ING Direct 2009 Annual Report Download - page 5
Download and view the complete annual report
Please find page 5 of the 2009 ING Direct annual report below. You can navigate through the pages in the report by either clicking on the pages listed below, or by using the keyword search tool below to find specific information within the annual report.-
 1
1 -
 2
2 -
 3
3 -
 4
4 -
 5
5 -
 6
6 -
 7
7 -
 8
8 -
 9
9 -
 10
10 -
 11
11 -
 12
12 -
 13
13 -
 14
14 -
 15
15 -
 16
16 -
17
-
18
-
19
-
20
-
21
-
22
-
23
-
24
-
25
-
26
-
27
-
28
-
29
-
30
-
31
-
32
-
33
-
34
-
35
-
36
-
37
-
38
-
39
-
40
-
41
-
42
-
43
-
44
-
45
-
46
-
47
-
48
-
49
-
50
-
51
-
52
-
53
-
54
-
55
-
56
-
57
-
58
-
59
-
60
-
61
-
62
-
63
-
64
-
65
-
66
-
67
-
68
-
69
-
70
-
71
-
72
-
73
-
74
-
75
-
76
-
77
-
78
-
79
-
80
-
81
-
82
-
83
-
84
-
85
-
86
-
87
-
88
-
89
-
90
-
91
-
92
-
93
-
94
-
95
-
96
-
97
-
98
-
99
-
100
-
101
-
102
-
103
-
104
-
105
-
106
-
107
-
108
-
109
-
110
-
111
-
112
-
113
-
114
-
115
-
116
-
117
-
118
-
119
-
120
-
121
-
122
-
123
-
124
-
125
-
126
-
127
-
128
-
129
-
130
-
131
-
132
-
133
-
134
-
135
-
136
-
137
-
138
-
139
-
140
-
141
-
142
-
143
-
144
-
145
-
146
-
147
-
148
-
149
-
150
-
151
-
152
-
153
-
154
-
155
-
156
-
157
-
158
-
159
-
160
-
161
-
162
-
163
-
164
-
165
-
166
-
167
-
168
-
169
-
170
-
171
-
172
-
173
-
174
-
175
-
176
-
177
-
178
-
179
-
180
-
181
-
182
-
183
-
184
-
185
-
186
-
187
-
188
-
189
-
190
-
191
-
192
-
193
-
194
-
195
-
196
-
197
-
198
-
199
-
200
-
201
-
202
-
203
-
204
-
205
-
206
-
207
-
208
-
209
-
210
-
211
-
212
-
213
-
214
-
215
-
216
-
217
-
218
-
219
-
220
-
221
-
222
-
223
-
224
-
225
-
226
-
227
-
228
-
229
-
230
-
231
-
232
-
233
-
234
-
235
-
236
-
237
-
238
-
239
-
240
-
241
-
242
-
243
-
244
-
245
-
246
-
247
-
248
-
249
-
250
-
251
-
252
-
253
-
254
-
255
-
256
-
257
-
258
-
259
-
260
-
261
-
262
-
263
-
264
-
265
-
266
-
267
-
268
-
269
-
270
-
271
-
272
-
273
-
274
-
275
-
276
-
277
-
278
-
279
-
280
-
281
-
282
-
283
-
284
-
285
-
286
-
287
-
288
-
289
-
290
-
291
-
292
-
293
-
294
-
295
-
296
-
297
-
298
-
299
-
300
-
301
-
302
-
303
-
304
-
305
-
306
-
307
-
308
-
309
-
310
-
311
-
312
 |
 |

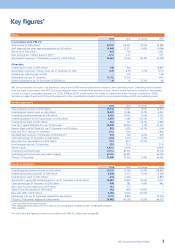
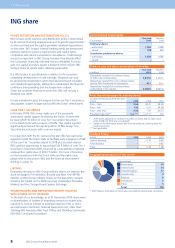
Key figures*
Group
2009 2008 % Change 2007
in accordance with IFRS-EU
Total income (in EUR million) 47,765 66,291 –27.9% 76,586
Staff expenses and other operating expenses (in EUR million) 14,049 15,571 –9.8% 15,468
Net result (in EUR million) –935 –729 9,241
Basic earnings per ordinary share (in EUR) (1) –0.57 –0.27 3.31
Shareholders' equity per 31 December (in parent, in EUR million) 33,863 17,33 4 95.4% 37,20 8
Other data
Underlying net result (in EUR million) 748 –304 8,816
Shareholders' equity per ordinary share per 31 December (in EUR) 8.95 8.55 4.7% 17.73
Dividend per ordinary share (in EUR) –0.74 1.48
Debt/equity ratio per 31 December 12.4% 13.5% 9.5%
Market capitalisation per 31 December (in EUR billion) 26 15 73.3% 60
ING Group evaluates the results of its businesses using a non-GAAP financial performance measure called underlying result. Underlying result is derived
from the result in accordance with IFRS-EU by excluding the impact of divestments and special items. Historic results have been restated for divestments
in order to create a comparable sequence (i.e. 2009, 2008 and 2007 results exclude the results of a divestment which has been completed in 2009).
See table on page 13 and note 51 Operating segments in the consolidated Annual Accounts for a reconciliation between IFRS and underlying result.
Banking operations
2009 2008 % Change 2007
Total underlying income (in EUR million) 13,312 11,731 13.5% 14,614
Underlying net interest result (in EUR million) 12,539 11,0 85 13.1% 9,061
Underlying operating expenses (in EUR million) 9,439 10,002 –5.6% 9,522
Underlying addition to loan loss provision (in EUR million) 2,973 1,280 132.3% 125
Underlying net result (in EUR million) 962 722 33.2% 3,982
Core Tier 1 capital ING Bank N.V. per 31 December 25,958 24,934 4.1% 23,375
Balance sheet total ING Bank N.V. per 31 December (in EUR billion) 882 1,035 –14.7% 994
Bank core Tier 1 ratio per 31 December (2) 7.8% 7.3% 5.8%
Risk-Weighted Assets per 31 December (in EUR billion) (2) 332 343 –3.2% 403
Client balances per 31 December (in EUR billion) 1,108 1,074 3.2% 1,013
Net production client balances (in EUR billion) 21.5 89.2 –75.9% (3)
Asset leverage ratio per 31 December 27. 8 35.3 39.0
Interest margin 1.32% 1.07% 0.94%
Underlying cost/income ratio 70.9% 85.3% 65.2%
Underlying cost/income ratio, excl market impacts 54.4% 65.4% 66.9%
FTEs per 31 December 71,088 75,109 –5.4% 66,182
Insurance operations
2009 2008 % Change 2007
Underlying gross premium income (in EUR million) 30,179 37,76 0 –20.1% 38,803
Underlying operating expenses (in EUR million) 3,849 4,273 –9.9% 4,228
Underlying net result (in EUR million) –214 –1,026 4,834
Shareholders’ equity ING Verzekeringen N.V. per 31 December (in EUR million) 15,887 11,892 33.6% 17,911
Client balances per 31 December (in EUR billion) 408 382 6.8% 442
Net production client balances (in EUR billion) –9.4 6.3 (3)
Value of new life business (in EUR million) 502 804 –37.6% (3)
New sales (APE, in EUR million) 4,456 5,944 –25.0% (3)
Debt/equity ratio per 31 December, adjusted for divestments 9.7% 8.8% 13.6%
FTEs per 31 December, adjusted for divestments 36,085 41,236 –12.5% 46,197
(1) See note 49 in the Annual Accounts.
(2) Risk-Weighted Assets and (core) Tier 1 ratios as from 2008 based on Basel II; before 2008 based on Basel I.
(3) Not available.
* For the 5-year key figures overview in accordance with IFRS-EU, please turn to page 89.
ING Group Annual Report 2009 3