ING Direct 2009 Annual Report Download - page 10
Download and view the complete annual report
Please find page 10 of the 2009 ING Direct annual report below. You can navigate through the pages in the report by either clicking on the pages listed below, or by using the keyword search tool below to find specific information within the annual report.-
 1
1 -
 2
2 -
 3
3 -
 4
4 -
 5
5 -
 6
6 -
 7
7 -
 8
8 -
 9
9 -
 10
10 -
 11
11 -
 12
12 -
 13
13 -
 14
14 -
 15
15 -
 16
16 -
 17
17 -
 18
18 -
 19
19 -
 20
20 -
 21
21 -
22
-
23
-
24
-
25
-
26
-
27
-
28
-
29
-
30
-
31
-
32
-
33
-
34
-
35
-
36
-
37
-
38
-
39
-
40
-
41
-
42
-
43
-
44
-
45
-
46
-
47
-
48
-
49
-
50
-
51
-
52
-
53
-
54
-
55
-
56
-
57
-
58
-
59
-
60
-
61
-
62
-
63
-
64
-
65
-
66
-
67
-
68
-
69
-
70
-
71
-
72
-
73
-
74
-
75
-
76
-
77
-
78
-
79
-
80
-
81
-
82
-
83
-
84
-
85
-
86
-
87
-
88
-
89
-
90
-
91
-
92
-
93
-
94
-
95
-
96
-
97
-
98
-
99
-
100
-
101
-
102
-
103
-
104
-
105
-
106
-
107
-
108
-
109
-
110
-
111
-
112
-
113
-
114
-
115
-
116
-
117
-
118
-
119
-
120
-
121
-
122
-
123
-
124
-
125
-
126
-
127
-
128
-
129
-
130
-
131
-
132
-
133
-
134
-
135
-
136
-
137
-
138
-
139
-
140
-
141
-
142
-
143
-
144
-
145
-
146
-
147
-
148
-
149
-
150
-
151
-
152
-
153
-
154
-
155
-
156
-
157
-
158
-
159
-
160
-
161
-
162
-
163
-
164
-
165
-
166
-
167
-
168
-
169
-
170
-
171
-
172
-
173
-
174
-
175
-
176
-
177
-
178
-
179
-
180
-
181
-
182
-
183
-
184
-
185
-
186
-
187
-
188
-
189
-
190
-
191
-
192
-
193
-
194
-
195
-
196
-
197
-
198
-
199
-
200
-
201
-
202
-
203
-
204
-
205
-
206
-
207
-
208
-
209
-
210
-
211
-
212
-
213
-
214
-
215
-
216
-
217
-
218
-
219
-
220
-
221
-
222
-
223
-
224
-
225
-
226
-
227
-
228
-
229
-
230
-
231
-
232
-
233
-
234
-
235
-
236
-
237
-
238
-
239
-
240
-
241
-
242
-
243
-
244
-
245
-
246
-
247
-
248
-
249
-
250
-
251
-
252
-
253
-
254
-
255
-
256
-
257
-
258
-
259
-
260
-
261
-
262
-
263
-
264
-
265
-
266
-
267
-
268
-
269
-
270
-
271
-
272
-
273
-
274
-
275
-
276
-
277
-
278
-
279
-
280
-
281
-
282
-
283
-
284
-
285
-
286
-
287
-
288
-
289
-
290
-
291
-
292
-
293
-
294
-
295
-
296
-
297
-
298
-
299
-
300
-
301
-
302
-
303
-
304
-
305
-
306
-
307
-
308
-
309
-
310
-
311
-
312
 |
 |

ING share
PROFIT RETENTION AND DISTRIBUTION POLICY
ING Group’s profit retention and distribution policy is determined
by its internal financing requirements and its growth opportunities
on the one hand and the capital providers’ dividend expectations
on the other. ING Group’s internal funding needs are determined
partly by statutory solvency requirements and capital ratios,
compliance with which is essential to its existence. Credit ratings
are just as important to ING Group, because they directly affect
the Company’s financing costs and hence profitability. For their
part, the capital providers expect a dividend which reflects ING
Group’s financial results and is relatively predictable.
It is ING’s policy to pay dividends in relation to the long-term
underlying development of cash earnings. Dividends can only
be declared by shareholders when the Executive Board considers
such dividends appropriate, taking into consideration the financial
conditions then prevailing and the longer-term outlook.
Given the uncertain financial environment, ING will not pay a
dividend over 2009.
In case a dividend is paid, the coupon on the core Tier 1 securities is
also payable, subject to approval by DNB (the Dutch central bank).
CORE TIER 1 SECURITIES
In October 2008, ING Group made use of the previously
announced capital support facilities by the Dutch Government
by issuing EUR 10 billion of core Tier 1 securities (‘Securities’)
to the Dutch State with a coupon of 8.5%. This capital injection
significantly enhanced the capital position of ING Group. The
Securities are pari passu with common equity.
In conjunction with the EC restructuring plan ING has reached an
agreement with the Dutch State to facilitate early repayment of half
of the core Tier 1 securities issued in 2008 plus accrued interest.
ING used the opportunity to repurchase EUR 5 billion of core Tier 1
securities in December 2009, financed by a successfully completed
underwritten rights issue of EUR 7.5 billion. For more information
on the transactions with the Dutch State and the rights issue,
please refer to the section ‘ING and the financial environment’
starting on page 10.
LISTINGS
Depositary receipts for ING Group ordinary shares are listed on the
stock exchanges of Amsterdam, Brussels and New York (NYSE).
Options on ING Group ordinary shares (or the depositary receipts
therefor) are traded on the NYSE Euronext Amsterdam Derivative
Markets and the Chicago Board Options Exchange.
SHAREHOLDERS AND DEPOSITARY-RECEIPT HOLDERS
WITH STAKES OF 5% OR MORE
To the best of our knowledge, as at 31 December 2009, there were
no shareholders or holders of depositary receipts for shares who
reported to hold an interest or potential interest of 5% or more
as mentioned in the Dutch Financial Supervision Act, other than
Stichting ING Aandelen (ING Trust Office) and Stichting Continuïteit
ING (ING Continuity Foundation).
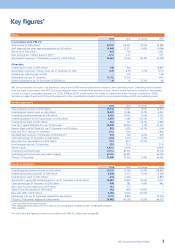
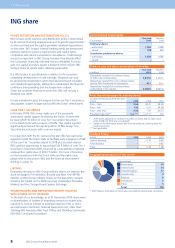
Authorised and issued capital
in EUR millions
Year-end
2009
Year-end
2008
Ordinary shares
– authorised 1,080 1,080
– issued 919 495
Cumulative preference shares
– authorised 1,080 1,080
– issued ––
Shares in issue and shares outstanding in the market
in millions
Year-end
2009
Year-end
2008
(Depositary receipts for) ordinary shares
of EUR 0.24 nominal value 3,831.6 2,063.1
(Depositary receipts for) own ordinary shares
held by ING Group and its subsidiaries 47.1 36.5
(Depositary receipts for) ordinary shares
outstanding in the market 3,784.5 2,026.6
Prices depositary receipts for ordinary shares*
Euronext Amsterdam by NYSE Euronext
in EUR 2009 2008 2007
Price – high 9.64 26.21 34.69
Price – low 1.92 5.33 24.38
Price – year end 6.90 7.33 26.75
Price/earnings ratio** n.a.*** n.a.*** 6.2
* 2009 prices adjusted for increase in number of shares due to rights issue,
while 2008 and 2007 are not adjusted.
** Based on the share price at year-end and net profit per ordinary share for
the financial year.
*** Not applicable.
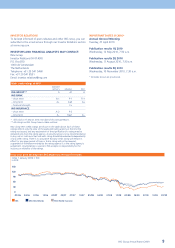
Dividend history
in EUR 2009 2008 2007
Interim dividend –0.74 0.66
Final dividend ––0.82
Total –0.74 1.48
* 2009 figures, estimated on information provided by several large custodians.
Geographical distribution of ING shares*
in percentages
Netherlands 34
United States 24
United Kingdom 17
Luxembourg 9
Belgium 6
Switzerland 5
Other 5
Total 100
1.1 Who we are
ING Group Annual Report 2009
8