ING Direct 2008 Annual Report Download - page 5
Download and view the complete annual report
Please find page 5 of the 2008 ING Direct annual report below. You can navigate through the pages in the report by either clicking on the pages listed below, or by using the keyword search tool below to find specific information within the annual report.-
 1
1 -
 2
2 -
 3
3 -
 4
4 -
 5
5 -
 6
6 -
 7
7 -
 8
8 -
 9
9 -
 10
10 -
 11
11 -
 12
12 -
 13
13 -
 14
14 -
 15
15 -
 16
16 -
17
-
18
-
19
-
20
-
21
-
22
-
23
-
24
-
25
-
26
-
27
-
28
-
29
-
30
-
31
-
32
-
33
-
34
-
35
-
36
-
37
-
38
-
39
-
40
-
41
-
42
-
43
-
44
-
45
-
46
-
47
-
48
-
49
-
50
-
51
-
52
-
53
-
54
-
55
-
56
-
57
-
58
-
59
-
60
-
61
-
62
-
63
-
64
-
65
-
66
-
67
-
68
-
69
-
70
-
71
-
72
-
73
-
74
-
75
-
76
-
77
-
78
-
79
-
80
-
81
-
82
-
83
-
84
-
85
-
86
-
87
-
88
-
89
-
90
-
91
-
92
-
93
-
94
-
95
-
96
-
97
-
98
-
99
-
100
-
101
-
102
-
103
-
104
-
105
-
106
-
107
-
108
-
109
-
110
-
111
-
112
-
113
-
114
-
115
-
116
-
117
-
118
-
119
-
120
-
121
-
122
-
123
-
124
-
125
-
126
-
127
-
128
-
129
-
130
-
131
-
132
-
133
-
134
-
135
-
136
-
137
-
138
-
139
-
140
-
141
-
142
-
143
-
144
-
145
-
146
-
147
-
148
-
149
-
150
-
151
-
152
-
153
-
154
-
155
-
156
-
157
-
158
-
159
-
160
-
161
-
162
-
163
-
164
-
165
-
166
-
167
-
168
-
169
-
170
-
171
-
172
-
173
-
174
-
175
-
176
-
177
-
178
-
179
-
180
-
181
-
182
-
183
-
184
-
185
-
186
-
187
-
188
-
189
-
190
-
191
-
192
-
193
-
194
-
195
-
196
-
197
-
198
-
199
-
200
-
201
-
202
-
203
-
204
-
205
-
206
-
207
-
208
-
209
-
210
-
211
-
212
-
213
-
214
-
215
-
216
-
217
-
218
-
219
-
220
-
221
-
222
-
223
-
224
-
225
-
226
-
227
-
228
-
229
-
230
-
231
-
232
-
233
-
234
-
235
-
236
-
237
-
238
-
239
-
240
-
241
-
242
-
243
-
244
-
245
-
246
-
247
-
248
-
249
-
250
-
251
-
252
-
253
-
254
-
255
-
256
-
257
-
258
-
259
-
260
-
261
-
262
-
263
-
264
-
265
-
266
-
267
-
268
-
269
-
270
-
271
-
272
-
273
-
274
-
275
-
276
-
277
-
278
-
279
-
280
-
281
-
282
-
283
-
284
 |
 |

ING Group Annual Report 2008
3
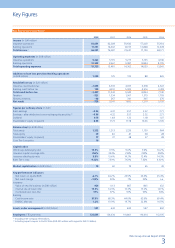
Key Figures
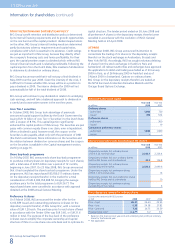
Key figures (on a total basis)
2008 2007 2006 2005 2004
Income (in EUR million)
Insurance operations 54,851 62,208 59,642 57,403 55,614
Banking operations 11,731 14,602 14,195 13,848 12,678
Total income (1) 66,291 76,587 73,621 71,120 68,171
Operating expenses (in EUR million)
Insurance operations 5,422 5,515 5,275 5,195 4,746
Banking operations 10,303 9,967 9,087 8,844 8,795
Total operating expenses 15,725 15,481 14,362 14,039 13,541
Addition to loan loss provision Banking operations
(in EUR million) 1,280 125 103 88 465
Result before tax (in EUR million)
Insurance result before tax –1,635 6,533 4,935 3,978 4,322
Banking result before tax 148 4,510 5,005 4,916 3,418
Total result before tax –1,487 11,0 43 9,940 8,894 7,74 0
Taxation –721 1,534 1,907 1,379 1,709
Minority interests –38 267 341 305 276
Net result –729 9,241 7,692 7,210 5,755
Figures per ordinary share (in EUR)
Basic earnings –0.36 4.32 3.57 3.32 2.71
Earnings – after attribution to non-voting equity securities (2) –0.56 4.32 3.57 3.32 2.71
Dividend 0.74 1.48 1.32 1.18 1.07
Shareholders’ equity (in parent) 8.55 17.73 17.78 16.96 12.95
Balance sheet (in EUR billion)
Total assets 1,332 1,313 1,226 1,159 964
Total equity 29 40 41 38 28
Shareholders’ equity (in parent) 17 37 38 37 28
Core Tier-1 securities 10
Capital ratios
ING Group debt/equity ratio 13.5% 9.5% 9.0% 9.4% 10.2%
Insurance capital coverage ratio 256% 244% 274% 255% 204%
Insurance debt/equity ratio 8.8% 13.6% 14.2% 13.4% 14.3%
Bank Tier-1 ratio 9.32% 7.39% 7.63% 7.32% 6.92%
Market capitalisation (in EUR billion) 15 60 74 65 49
Key performance indicators
Net return on equity (ROE) –2.1% 24.2% 23.5% 26.6% 25.4%
Net result change –108% 20% 7% 25% n.a.
Insurance
Value of new life business (in EUR million) 924 1,113 807 805 632
Internal rate of return (life) 13.9% 14.3% 13.3% 13.2% 12.1%
Combined ratio (non-life) 97% 97% 91% 95% 94%
Banking
Cost/income ratio 87.8% 68.3% 64.0% 63.9% 69.4%
RAROC after tax 1.2% 19.9% 19.7% 22.6% 14.5%
Assets under management (in EUR billion) 551 643 600 547 492
Employees (FTEs year-end) 124,661 124,634 119, 8 01 116,614 112,19 5
(1) Including inter-company eliminations.
(2) Including impact coupon to Dutch State (EUR 425 million with regard to EUR 10 billion).