ING Direct 2008 Annual Report Download - page 15
Download and view the complete annual report
Please find page 15 of the 2008 ING Direct annual report below. You can navigate through the pages in the report by either clicking on the pages listed below, or by using the keyword search tool below to find specific information within the annual report.-
 1
1 -
2
-
3
-
4
-
 5
5 -
 6
6 -
 7
7 -
 8
8 -
 9
9 -
 10
10 -
 11
11 -
 12
12 -
 13
13 -
 14
14 -
 15
15 -
 16
16 -
 17
17 -
 18
18 -
 19
19 -
 20
20 -
 21
21 -
 22
22 -
 23
23 -
 24
24 -
 25
25 -
26
-
27
-
28
-
29
-
30
-
31
-
32
-
33
-
34
-
35
-
36
-
37
-
38
-
39
-
40
-
41
-
42
-
43
-
44
-
45
-
46
-
47
-
48
-
49
-
50
-
51
-
52
-
53
-
54
-
55
-
56
-
57
-
58
-
59
-
60
-
61
-
62
-
63
-
64
-
65
-
66
-
67
-
68
-
69
-
70
-
71
-
72
-
73
-
74
-
75
-
76
-
77
-
78
-
79
-
80
-
81
-
82
-
83
-
84
-
85
-
86
-
87
-
88
-
89
-
90
-
91
-
92
-
93
-
94
-
95
-
96
-
97
-
98
-
99
-
100
-
101
-
102
-
103
-
104
-
105
-
106
-
107
-
108
-
109
-
110
-
111
-
112
-
113
-
114
-
115
-
116
-
117
-
118
-
119
-
120
-
121
-
122
-
123
-
124
-
125
-
126
-
127
-
128
-
129
-
130
-
131
-
132
-
133
-
134
-
135
-
136
-
137
-
138
-
139
-
140
-
141
-
142
-
143
-
144
-
145
-
146
-
147
-
148
-
149
-
150
-
151
-
152
-
153
-
154
-
155
-
156
-
157
-
158
-
159
-
160
-
161
-
162
-
163
-
164
-
165
-
166
-
167
-
168
-
169
-
170
-
171
-
172
-
173
-
174
-
175
-
176
-
177
-
178
-
179
-
180
-
181
-
182
-
183
-
184
-
185
-
186
-
187
-
188
-
189
-
190
-
191
-
192
-
193
-
194
-
195
-
196
-
197
-
198
-
199
-
200
-
201
-
202
-
203
-
204
-
205
-
206
-
207
-
208
-
209
-
210
-
211
-
212
-
213
-
214
-
215
-
216
-
217
-
218
-
219
-
220
-
221
-
222
-
223
-
224
-
225
-
226
-
227
-
228
-
229
-
230
-
231
-
232
-
233
-
234
-
235
-
236
-
237
-
238
-
239
-
240
-
241
-
242
-
243
-
244
-
245
-
246
-
247
-
248
-
249
-
250
-
251
-
252
-
253
-
254
-
255
-
256
-
257
-
258
-
259
-
260
-
261
-
262
-
263
-
264
-
265
-
266
-
267
-
268
-
269
-
270
-
271
-
272
-
273
-
274
-
275
-
276
-
277
-
278
-
279
-
280
-
281
-
282
-
283
-
284
 |
 |

ING Group Annual Report 2008
13
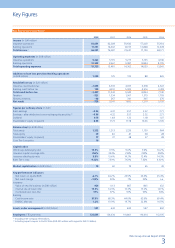
Financial highlights
Results impacted by dislocation in financial markets
In 2008, ING’s results were adversely impacted by the
global financial crisis. The sharp market deterioration led
to significant impairments and negative revaluations
across almost all asset classes. Several steps were taken to
strengthen ING Group’s capital position, including a capital
support facility of EUR 10 billion by the Dutch State. ING
also actively reduced risk exposures. The turmoil in financial
markets caused a sharp decline in results for ING’s insurance
operations. At the same time, the banking business reported
positive net results despite the challenging circumstances.
GROUP RESULTS
Total net result decreased from EUR 9,241 million in 2007 to
EUR -729 million. Underlying net result, which is defined as total
net result excluding the impact of divestments and special items,
decreased from EUR 9,172 million to EUR -171 million. Underlying
result before tax decreased from EUR 11,080 million to EUR -786
million. Extreme market volatility and sharp declines in asset prices
triggered impairments and fair value changes of EUR 5,081
million, of which EUR 2,599 million related to pressurised assets
and EUR 1,707 million to equity securities. The remainder was
attributable to impairments on other debt securities, including
financial institutions’ debt.
Globally, real estate prices fell noticeably in 2008, leading
to negative revaluations on real estate and impairments on
development projects of EUR 1,184 million. Negative revaluations
on private equity were EUR 399 million. Other impacts stemming
from the weak financial landscape were EUR -162 million, including
deferred acquisition cost unlocking and hedge losses, partly
compensated by capital gains on equity securities. The weakening
of most currencies against the euro during 2008 had a negative
impact of EUR 163 million on net underlying result. Earnings per
share decreased to EUR -0.36 from EUR 4.32.
Commercial performance
Underlying result before tax of the Insurance operations decreased
to a loss of EUR 1,235 million in 2008 from a profit of EUR 6,113
million in 2007. The sharp decline in results was mainly due to the
financial market deterioration in the second half of 2008. However,
the reported decline in 2008 is somewhat distorted by the fact
that EUR 2,087 million in capital gains were booked in 2007.
Underlying result before tax of the Banking operations declined by
91.0% to EUR 449 million. Retail Banking and Wholesale Banking
remained profitable, while ING Direct turned to a loss of EUR 1,125
million due to impairments on pressurised assets.
Measured over the full-year 2008, net production of client
balances was EUR 93 billion, excluding currency impacts. Including
the impact of currency effects, total client balances remained
stable at EUR 1,455 billion compared with the previous year.
Client savings and deposits accounted for EUR 21 billion of the
net production (excluding currency effects), EUR 12 billion of which
was attributable to retail customers. At Insurance, positive net
production of client balances was generated by all business lines
as inflows in life insurance and retirement services more than
offset outflows in third-party assets under management.
Overall, lending growth was robust in 2008, despite a fourth
quarter decline in all markets except for the Netherlands. Of the
client balance net production, bank lending contributed EUR 59
billion in 2008, excluding currency effects.
Bringing expenses in line with operating environment
Underlying operating expenses (i.e. excluding the impact of
divestments and special items) from Insurance operations
decreased 0.6%. Underlying operating expenses from Banking
operations increased 5.0% to EUR 10,002 million mainly at Retail
Banking (due to the inclusion of ING Bank Turkey, formerly Oyak
Bank) and ING Direct.
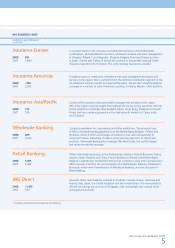
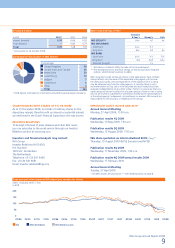
Contribution business lines to underlying result,
excluding market volatility and risk costs
in percentages
Insurance Europe 15
Insurance Americas 17
Insurance Asia/Pacific 6
Wholesale Banking 26
Retail Banking 24
ING Direct 12
Total 100
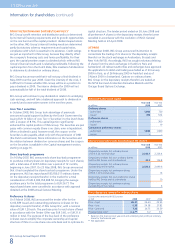
ING results 2008*
Year-end 2008
in EUR million Bank Insurance Group
Underlying result, excluding
market volatility and risk costs 5,263 2,057 7,319
Impairments and FV changes on
pressurised assets –2,039 –560 –2,599
Impairments on equity securities –331 –1,376 –1,707
Impairments on other debt securities –255 –520 –775
Impairments and losses –2,625 –2,455 –5,081
Revaluations on real estate/
impairments on development projects –732 –452 –1,184
Revaluations on private equity –399 –399
Revaluations –732 –851 –1,583
Equity capital gains/equity hedge 30 1,181 1, 211
Equity related DAC unlocking –567 –567
FX hedge/Other –206 –600 –806
Other market impacts –176 14 –162
Risk costs Bank –1,280 –1,280
Underlying result before tax 449 –1,235 –786
Tax and third-party interests 273 343 615
Underlying net result 722 –893 –171
Divestments and special items –267 –291 –558
Total net result 454 –1,183 –729
* Numbers may not add up due to rounding.