ING Direct 2008 Annual Report Download - page 20
Download and view the complete annual report
Please find page 20 of the 2008 ING Direct annual report below. You can navigate through the pages in the report by either clicking on the pages listed below, or by using the keyword search tool below to find specific information within the annual report.
ING Group Annual Report 2008
1.2 Report of the Executive Board
18
Capital management (continued)
Available for sale assets are marked to market through
Shareholders’ equity whilst liabilities are booked on an
amortised cost basis. If ING Group were to mark its financial
liabilities (senior term debt, dated subordinated debt and hybrids)
to market, approximately EUR 12 billion would be added to
Shareholders’ equity at the end of 2008. Adjusted equity
improved by EUR 1 billion in spite of the decline in Shareholders’
equity because of an increase in hybrid Tier-1 capital, the capital
injection from the Dutch State and the adding back of the
revaluation reserve.
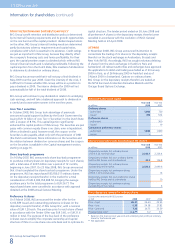
KEY CAPITAL AND LEVERAGE RATIOS
Group leverage, defined as equity investments into Bank and
Insurance from Group minus adjusted Group equity, increased
from EUR 5 billion to EUR 7 billion or, in other words, from 9.5% to
13.5%. Group paid out EUR 3 billion in dividends to shareholders
and EUR 2 billion on the remainder of the share buy-back. Group
injected EUR 2.95 billion into Bank and EUR 2.65 billion into
Insurance during the year. As indicated, Group also received
a capital injection from the Dutch State of EUR 10 billion.
Group raised EUR 1.5 billion and USD 2 billion of hybrid Tier-1
capital during 2008. The EUR issue was on-lent to Insurance and
Bank on a 50/50 basis. The USD issue was on-lent to Insurance and
Bank on a 75/25 basis. Also during the year a net USD 600 million
of hybrids were moved from Bank to Insurance.
Tier-1 capital at Bank increased from EUR 30 billion to EUR 32
billion, although the definition of Tier-1 capital changed, moving
from Basel I to Basel II. Basel II Tier-1 capital is approximately
EUR 1 billion less than Basel I Tier-1 due to different deduction
rules. Net profit in Bank was approximately EUR 0.5 billion. RWAs
grew by 17% from EUR 293 billion at the start of the year to
EUR 343 billion at the end of the year. Basel I RWAs grew by
18% from EUR 403 billion to EUR 477 billion at the end of the year.
The nominal balance sheet of Bank increased from EUR 994 billion
to EUR 1,030 billion, only 4%. The difference between nominal
balance sheet growth and the growth of RWAs can be explained
by the relative reduction of money market activities. Nominal
lending by Bank grew from EUR 526 billion to EUR 598 billion, an
increase of 14%.
The debt/equity ratio of Insurance decreased from 14% to 9%
in spite of significant capital injections into operating subsidiaries
throughout the year, especially in the fourth quarter. The amount
was a net EUR 4 billion, compensated, however, by capital
injections from Group and the on-lending of hybrid Tier-1 capital.
At the end of the year Insurance had a hybrid ratio slightly above
the 25% target.
AVAILABLE FINANCIAL RESOURCES
AND ECONOMIC CAPITAL
Increasingly ING looks at Available Financial Resources (AFR) and
Economic Capital (EC) employed when managing capital. These
concepts come from our internal risk management models.
EC is a measure for the totality of risks run in the company over
a one-year time horizon and with a AA confidence interval of
99.95%. AFR equals market value of assets minus market value
of liabilities, excluding hybrids issued by ING Group which are
counted as capital. At ING Bank the proxy for AFR is Tier-1 capital
with certain adjustments, in the absence of a full market value
balance sheet for ING Bank. AFR should exceed EC for both ING
Bank and ING Insurance. EC for ING Group is defined as EC ING
Bank plus EC ING Insurance minus the diversification benefit. The
diversification is partially due to opposite interest rate positions in
ING Bank and Insurance and is prudently estimated at 15%. AFR
ING Group equals AFR ING Bank plus AFR ING Insurance minus
core debt ING Group. The target is that ING Group AFR should be
at least 120% of ING Group EC. It is policy that any buffer should
be able to be deployed with maximum flexibility and therefore be
kept centrally. Free surplus is defined as the difference between
AFR and EC.
AFR Bank increased from EUR 32 billion to EUR 35 billion during
the year. The capital injections from Group to Bank more than
compensated the loss for the year. EC Bank increased from
EUR 18 billion to EUR 22 billion, given the increase in RWAs and
also a methodology change. Interest rate risk resulting from the
investment of capital is now included in the calculation. The free
surplus at Bank declined from EUR 14 billion to EUR 13 billion.
AFR Insurance declined in light of the adverse market
circumstances (higher credit spreads, lower interest rates and lower
equity markets) and the incurred loss of over EUR 1 billion from
EUR 23 billion to EUR 14 billion during the year. EC Insurance,
however, decreased as well from EUR 23 billion to EUR 14 billion,
given the sale of ING Life Taiwan and other actions implemented
to reduce risk in spite of lower interest rates. This means that there
was a small free surplus at Insurance at the end of the year. AFR
and EC are adjusted to reflect illiquidity in the insurance portfolios
as reporting AFR and EC with MVLs discounted at swap rates
results in an asymmetry between the assets and liabilities in terms
of reflection of illiquidity premiums. This has been approximated
by applying a AAA covered bond spread to the valuation of the
insurance liability cash flows, adjusted for the US and Japan with
the difference between the local AAA corporate spreads and the
European corporate spreads. At year-end 2007 the swap rate
was used.
AFR ING Group decreased from EUR 50 billion to EUR 42 billion
during 2008, while EC ING Group decreased from EUR 36 billion
to EUR 31 billion. Thus the free surplus declined from EUR 14
billion to EUR 11 billion. This means that the capital buffer
decreased from 138% at the end of 2007 to 137% at the end of
2008. Going forward we expect the AFR and EC numbers, given
that they are market value based, to continue to be quite volatile.
THE INVESTMENT OF CAPITAL AND THE METHOD
OF CHARGING FOR IT
Banks have developed methods of partitioning the balance sheet’s
assets and liabilities in books where assets are matched against
liabilities. This allows for more granular risk management of the
balance sheet. The surplus assets that offset equity are separated
and it is good practice for these assets to be (at least notionally)
invested risk free. This stems from the idea that risks are best run
(with the most return) in the business and that the surplus assets
representing equity are there to support the business risks and
should not themselves be at risk. Insurance companies have
developed this discipline of matching assets against liabilities and
equity to a much lesser extent, in part due to the fact that the
time horizons of insurers are longer than those of banks.


