ING Direct 2002 Annual Report Download - page 3
Download and view the complete annual report
Please find page 3 of the 2002 ING Direct annual report below. You can navigate through the pages in the report by either clicking on the pages listed below, or by using the keyword search tool below to find specific information within the annual report.-
 1
1 -
 2
2 -
 3
3 -
 4
4 -
 5
5 -
 6
6 -
 7
7 -
 8
8 -
 9
9 -
 10
10 -
 11
11 -
 12
12 -
 13
13 -
 14
14 -
15
-
16
-
17
-
18
-
19
-
20
-
21
-
22
-
23
-
24
-
25
-
26
-
27
-
28
-
29
-
30
-
31
-
32
-
33
-
34
-
35
-
36
-
37
-
38
-
39
-
40
-
41
-
42
-
43
-
44
-
45
-
46
-
47
-
48
-
49
-
50
-
51
-
52
-
53
-
54
-
55
-
56
-
57
-
58
-
59
-
60
-
61
-
62
-
63
-
64
-
65
-
66
-
67
-
68
-
69
-
70
-
71
-
72
-
73
-
74
-
75
-
76
-
77
-
78
-
79
-
80
-
81
-
82
-
83
-
84
-
85
-
86
-
87
-
88
-
89
-
90
-
91
-
92
-
93
-
94
-
95
-
96
-
97
 |
 |

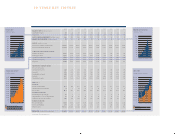
EMPLOYEES
average full-time equivalents
120,000
110,000
100,000
90,000
80,000
70,000
60,000
50,000
40,000
30,000
20,000
10,000
0
93 94 95 96 97 98 99 00 01 02
Netherlands
International
TOTAL ASSETS
in billions of euros
1,000
900
800
700
600
500
400
300
200
100
0
93 94 95 96 97 98 99 00 01 02
MARKET CAPITALISATION
in billions of euros
100
90
80
70
60
50
40
30
20
10
0
93 94 95 96 97 98 99 00 01 02
OPERATIONAL RESULTS
in millions of euros
6,000
5,500
5,000
4,500
4,000
3,500
3,000
2,500
2,000
1,500
1,000
500
0
93 94 95 96 97 98 99 00 01 02
Operational net profit
Operational result before taxation
2002 2001 2000 1999 1998
BALANCE SHEET (in billions of euros)
Shareholders’ equity 18 22 25 35 29
Total assets 716 705 650 493 395
ASSETS UNDER MANAGEMENT (in billions of euros) 449 513 503 345 253
MARKET CAPITALISATION (in billions of euros) 32 57 83 58 50
RESULTS (in millions of euros)
Income from insurance operations (1) 65,337 63,077 38,307 29,720 26,908
Income from banking operations 11,201 11,111 11,302 9,876 8,415
OPERATIONAL RESULT BEFORE TAXATION
Insurance operations 4,173 3,571 3,162 2,400 2,065
Banking operations 1,468 2,170 2,605 1,981 804
Operational result before taxation 5,641 5,741 5,767 4,381 2,869
Operational net profit 4,253 4,252 4,008 3,229 2,103
Net profit 4,500 4,577 11,984 4,922 2,669
FIGURES PER ORDINARY SHARE
(EUR 0.24 nominal value)
Operational net profit 2.20 2.20 2.09 1.68 1.12
Net profit 2.32 2.37 6.27 2.56 1.42
Distributable net profit 2.20 2.20 2.56 1.84 1.42
Dividend 0.97 0.97 1.13 0.82 0.63
Shareholders’ equity 9.14 11.03 13.04 17.90 15.21
RATIOS (in %)
ING GROUP
Return on equity (ROE) 21.6 18.4 12.2 10.3 8.3
Operational net profit growth 062453 -4
Pay-out ratio 44.1 44.1 43.9 44.4 43.9
INSURANCE OPERATIONS
Premium/expense growth gap 16 3279
Life premiums as a % of total premiums 85 88 86 84 82
Combined ratio non-life insurance 102 103 104 107 106
BANKING OPERATIONS
BIS ratio ING Bank 10.98 10.57 10.75 10.38 10.86
Tier-1 ratio ING Bank 7.31 7.03 7.22 7.02 7.14
Efficiency ratio 71.0 (2) 71.7 (2 ) 72.1 (2 ) 73.6 (2 ) 79.7
EMPLOYEES (average full-time equivalents) 113,060 112,000 92,650 86,040 82,750
(1) Restated. (2) Excluding ING Direct.
1997 1996 1995 1994 1993
22 16 11 10 10
282 221 180 160 154
174 112 95 57 53
32 22 14 10 11
19,535 15,226 13,447 12,757 13,424
6,306 5,316 4,428 3,706 3,529
1,644 1,101 929 809 707
1,276 968 795 685 607
2,920 2,069 1,724 1,494 1,314
2,180 1,507 1,202 1,045 921
2,206 1,507 1,202 1,045 921
1.40 1.04 0.87 0.79 0.73
1.42 1.04 0.87 0.79 0.73
1.42 1.04 0.87 0.79 0.73
0.52 0.46 0.38 0.34 0.32
13.30 10.63 7.56 7.23 7.46
12.0 11.5 12.1 10.6 8.6
45 25 15 13 11
36.9 43.9 43.2 43.0 43.4
63-249
75 70 69 69 68
102 103 104 105 108
10.77 10.89 11.07 11.12 10.90
7.13 7.57 6.79 6.59 6.18
72.8 72.1 70.9 68.9 70.2
64,160 55,990 52,140 46,980 49,030