ING Direct 2002 Annual Report Download - page 10
Download and view the complete annual report
Please find page 10 of the 2002 ING Direct annual report below. You can navigate through the pages in the report by either clicking on the pages listed below, or by using the keyword search tool below to find specific information within the annual report.-
 1
1 -
 2
2 -
 3
3 -
 4
4 -
 5
5 -
 6
6 -
 7
7 -
 8
8 -
 9
9 -
 10
10 -
 11
11 -
 12
12 -
 13
13 -
 14
14 -
 15
15 -
 16
16 -
 17
17 -
 18
18 -
 19
19 -
 20
20 -
 21
21 -
22
-
23
-
24
-
25
-
26
-
27
-
28
-
29
-
30
-
31
-
32
-
33
-
34
-
35
-
36
-
37
-
38
-
39
-
40
-
41
-
42
-
43
-
44
-
45
-
46
-
47
-
48
-
49
-
50
-
51
-
52
-
53
-
54
-
55
-
56
-
57
-
58
-
59
-
60
-
61
-
62
-
63
-
64
-
65
-
66
-
67
-
68
-
69
-
70
-
71
-
72
-
73
-
74
-
75
-
76
-
77
-
78
-
79
-
80
-
81
-
82
-
83
-
84
-
85
-
86
-
87
-
88
-
89
-
90
-
91
-
92
-
93
-
94
-
95
-
96
-
97
 |
 |

Annual Report 2002 · ING Group 7
Information for Shareholders
DIVIDEND HISTORY
in euros PROPOSED
2002 2001 2000 1999 1998
Interim dividend 0.48 0.47 0.41 0.32 0.30
Final dividend 0.49 0.50 0.72* 0.50 0.33
Total 0.97 0.97 1.13 0.82 0.63
* including an exceptional dividend of EUR 0.19.
GEOGRAPHICAL DISTRIBUTION
OF ING SHARES
in %
25
22
22
9
8
5
3
6
United Kingdom
US and Canada
The Netherlands
Luxembourg
Belgium
Switzerland
Germany
Others
120
110
100
90
80
70
60
50
40
30
20
ING Amsterdam AEX-index New York Dow Jones-index
01/01 04/01 07/01 10/01 01/02 01/03
04/02 07/02 10/02
ING GROUP SHARE
price/earnings ratio
25.0
22.5
20.0
17.5
15.0
12.5
10.0
7.5
5.0
2.5
0
98 99 00 01 02
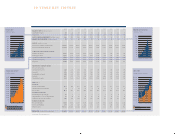
PRICES DEPOSITARY RECEIPTS FOR ORDINARY SHARES
Euronext Amsterdam Stock Exchange, in euros
2002 2001 2000 1999 1998
Price - high 31.20 43.97 42.76 30.59 34.83
Price - low 13.29 22.80 24.26 22.18 15.70
Price - year-end 16.14 28.64 42.54 29.97 25.98
Price/earnings ratio * 7.3 13.0 20.4 17.9 23.3
*Based on the share price at the end of December and net operational profit per ordinary share for the financial year.
SHARES AND WARRANTS IN ISSUE
in millions YEAR-END YEAR-END
2002 2001
(Depositary receipts for) ordinary
shares of EUR 0.24 nominal value 1,992.7 1,992.7
(Depositary receipts for) preference
shares of EUR 1.20 nominal value 87.1 87.1
Warrants B 17.2 17.2
(Depositary receipts for) own
ordinary shares held by ING Group
and its subsidiaries 28.4 69.1
AUTHORISED AND ISSUED CAPITAL
in millions of euros YEAR-END YEAR-END
2002 2001
ORDINARY SHARES
- authorised 720.0 720.0
- issued 478.2 478.2
PREFERENCE SHARES
- authorised 360.0 360.0
- issued 104.5 104.5
CUMULATIVE PREFERENCE SHARES
- authorised 1,080.0 1,080.0
- issued ––
*
Annual General Meeting of Shareholders
Tuesday, 15 April 2003, 10:30 am
Circustheater, The Hague
ING share quotation ex final dividend 2002
Thursday, 17 April 2003
Payment 2002 final dividend
Friday, 23 May 2003
Publication first-quarter results 2003
Thursday, 15 May 2003
Publication second-quarter results 2003
Thursday, 14 August 2003
ING share quotation ex interim dividend 2003
Monday, 18 August 2003
Publication third-quarter results 2003
Friday, 14 November 2003
* All dates shown are provisional.
PRICES DEPOSITARY RECEIPTS FOR ORDINARY SHARES
index: 1 January 2001 = 100