Huntington National Bank 2010 Annual Report Download - page 6
Download and view the complete annual report
Please find page 6 of the 2010 Huntington National Bank annual report below. You can navigate through the pages in the report by either clicking on the pages listed below, or by using the keyword search tool below to find specific information within the annual report.-
 1
1 -
 2
2 -
 3
3 -
 4
4 -
 5
5 -
 6
6 -
 7
7 -
 8
8 -
 9
9 -
 10
10 -
 11
11 -
 12
12 -
 13
13 -
 14
14 -
 15
15 -
 16
16 -
 17
17 -
18
-
19
-
20
-
21
-
22
-
23
-
24
-
25
-
26
-
27
-
28
-
29
-
30
-
31
-
32
-
33
-
34
-
35
-
36
-
37
-
38
-
39
-
40
-
41
-
42
-
43
-
44
-
45
-
46
-
47
-
48
-
49
-
50
-
51
-
52
-
53
-
54
-
55
-
56
-
57
-
58
-
59
-
60
-
61
-
62
-
63
-
64
-
65
-
66
-
67
-
68
-
69
-
70
-
71
-
72
-
73
-
74
-
75
-
76
-
77
-
78
-
79
-
80
-
81
-
82
-
83
-
84
-
85
-
86
-
87
-
88
-
89
-
90
-
91
-
92
-
93
-
94
-
95
-
96
-
97
-
98
-
99
-
100
-
101
-
102
-
103
-
104
-
105
-
106
-
107
-
108
-
109
-
110
-
111
-
112
-
113
-
114
-
115
-
116
-
117
-
118
-
119
-
120
-
121
-
122
-
123
-
124
-
125
-
126
-
127
-
128
-
129
-
130
-
131
-
132
-
133
-
134
-
135
-
136
-
137
-
138
-
139
-
140
-
141
-
142
-
143
-
144
-
145
-
146
-
147
-
148
-
149
-
150
-
151
-
152
-
153
-
154
-
155
-
156
-
157
-
158
-
159
-
160
-
161
-
162
-
163
-
164
-
165
-
166
-
167
-
168
-
169
-
170
-
171
-
172
-
173
-
174
-
175
-
176
-
177
-
178
-
179
-
180
-
181
-
182
-
183
-
184
-
185
-
186
-
187
-
188
-
189
-
190
-
191
-
192
-
193
-
194
-
195
-
196
-
197
-
198
-
199
-
200
-
201
-
202
-
203
-
204
-
205
-
206
-
207
-
208
-
209
-
210
-
211
-
212
-
213
-
214
-
215
-
216
-
217
-
218
-
219
-
220
-
221
-
222
-
223
-
224
-
225
-
226
-
227
-
228
 |
 |

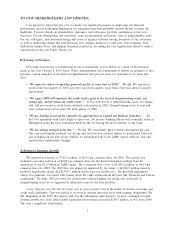
make up for this lost revenue, some banks have raised fees, eliminated free checking, or taken other
customer-unfriendly actions. Our view is that such actions will only further frustrate and alienate
banking customers. Consistent with our “Fair Play” banking philosophy, in September, we introduced
24-hour Grace
TM
on personal overdraft fees. This gives consumers until the next business day to correct
an overdraft balance in their account and avoid an overdraft fee. Customers are responding very
positively, with this contributing to our higher than expected growth in consumer households. In 2009,
service charge on deposit accounts represented 12% of total revenue. This dropped to 10% of total
revenue in 2010, reflecting a $20.1 million decline in the second half of last year as Reg E was
implemented in August. In 2011, we face a full-year’s impact, which we estimated could be as much
as $45 million.
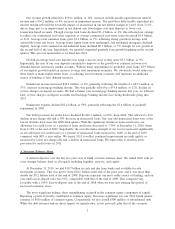
Durbin Amendment — When the Dodd-Frank Wall Street Reform and Consumer Protection Act
(Dodd-Frank Act) was passed last year, an amendment was added at the last moment, the Durbin
Amendment. This amendment instructed the Federal Reserve to establish the rate merchants pay banks
for electronic clearing of debit card transactions (i.e., the interchange rate). Interchange fees accounted
for about $90 million, or just over 80%, of our electronic banking income last year, our fourth largest
fee income activity. In the fourth quarter, the Federal Reserve put out a proposal for comment that
would cap the interchange rate at either $0.07 or $0.12 per transaction. While these rates are not
finalized, if they stand, we estimate that between 75%-85% of our interchange income could be lost.
The new rate is scheduled to take effect July 21, 2011. If enacted as proposed, this would represent a
significant earnings headwind with a loss of revenue of $68-$77 million annually.
Consumer Financial Protection Bureau (CFPB) — This bureau was also created by the Dodd-
Frank Act. It currently is in the process of being organized and staffed, and it is targeted to be
operational by July 2011. It will have extensive regulatory and enforcement powers over consumer
financial products and services. Exactly what rules, regulations, or requirements will ultimately be
mandated and their effect on banking and overall competitiveness is not known. But we believe they
are likely to result in further restrictions on fees and may mandate changes in product offerings.
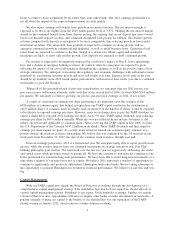
•A stable economic environment that may begin to expand. Our markets appear to have stabilized. It
was encouraging to see some economic growth, especially toward the end of last year. Our most
profitable use of deposit growth is making loans. We saw growth in loans throughout 2010, and in fact,
we began growing loans earlier than many of our peers. Nevertheless, a lack of customer confidence to
borrow and invest in their businesses remains. As such, growth in deposits outstripped growth in loans.
Our profitability will benefit from more balance between the growth of deposits and loans.
•An increase in long-term interest rates late in 2010. The Federal Reserve has maintained a low
interest rate environment as part of its strategy to spur economic activity. During the fourth quarter,
long-term interest rates increased. This had a dramatic slowing effect on mortgage refinance activity as
the year ended. Last year’s $175.8 million in mortgage banking income was a banner year. It
represented 7% of total revenue, and it was our second largest fee income activity.
2011 Outlook
Borrower and consumer confidence remains a major factor impacting growth opportunities for 2011. We
continue to believe that the economy will remain relatively stable throughout the coming year, with the
potential for improvement in the latter half. Revenue headwinds as a result of environmental factors noted
above will represent challenges to earnings growth.
Nevertheless, we anticipate net income will grow throughout 2011.
The primary driver of net income growth is expected to come from a decline in provision for credit
losses. We anticipate the absolute levels of net charge-offs and nonperforming assets will continue to decline.
Provision for credit losses will likely decline faster than net charge-offs since much of the charge-offs are
expected to relate to loans with previously established reserves. Our credit quality metrics are improving
quickly and faster than those of many of our peers. As such, we expect the level of our provision for credit
4