Huntington National Bank 2004 Annual Report Download - page 10
Download and view the complete annual report
Please find page 10 of the 2004 Huntington National Bank annual report below. You can navigate through the pages in the report by either clicking on the pages listed below, or by using the keyword search tool below to find specific information within the annual report.-
 1
1 -
 2
2 -
 3
3 -
 4
4 -
 5
5 -
 6
6 -
 7
7 -
 8
8 -
 9
9 -
 10
10 -
 11
11 -
 12
12 -
 13
13 -
 14
14 -
 15
15 -
 16
16 -
 17
17 -
 18
18 -
 19
19 -
 20
20 -
 21
21 -
22
-
23
-
24
-
25
-
26
-
27
-
28
-
29
-
30
-
31
-
32
-
33
-
34
-
35
-
36
-
37
-
38
-
39
-
40
-
41
-
42
-
43
-
44
-
45
-
46
-
47
-
48
-
49
-
50
-
51
-
52
-
53
-
54
-
55
-
56
-
57
-
58
-
59
-
60
-
61
-
62
-
63
-
64
-
65
-
66
-
67
-
68
-
69
-
70
-
71
-
72
-
73
-
74
-
75
-
76
-
77
-
78
-
79
-
80
-
81
-
82
-
83
-
84
-
85
-
86
-
87
-
88
-
89
-
90
-
91
-
92
-
93
-
94
-
95
-
96
-
97
-
98
-
99
-
100
-
101
-
102
-
103
-
104
-
105
-
106
-
107
-
108
-
109
-
110
-
111
-
112
-
113
-
114
-
115
-
116
-
117
-
118
-
119
-
120
-
121
-
122
-
123
-
124
-
125
-
126
-
127
-
128
-
129
-
130
-
131
-
132
-
133
-
134
-
135
-
136
-
137
-
138
-
139
-
140
-
141
-
142
 |
 |

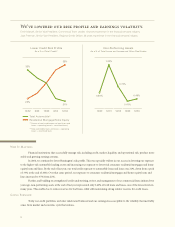
We’ve lowered our risk profile and earnings volatility.
Ernie Manuel, Senior Vice President, Commercial Team Leader, 19 years experience in the financial services industry
Jack Freeman, Senior Vice President, Regional Credit Officer, 26 years experience in the financial services industry
Financial institutions that successfully manage risk, including credit, market, liquidity, and operational risk, produce more
stable and growing earnings streams.
In 2004, we continued to lower Huntington’s risk profile. This was especially evident in our success in lowering our exposure
to the higher-risk automobile lending sector and increasing our exposure to lower-risk consumer residential mortgages and home
equity loans and lines. By the end of last year, our total credit exposure to automobile loans and leases was 21%, down from a peak
of 33% at the end of 2002. Over that same period, our exposure to consumer residential mortgages and home equity loans and
lines increased to 35% from 22%.
Further, and building on strengthened credit underwriting, review, and management of our commercial loans initiated two
years ago, non-performing assets at the end of last year represented only 0.46% of total loans and leases, one of the lowest levels in
many years. This enabled us to reduce reserves for bad loans, while still maintaining strong relative reserves for credit losses.
Today our credit portfolios are better risk/reward balanced and our earnings less susceptible to the volatility that inevitably
arises from market and economic cycle fluctuations.
Lower Credit Risk Profile
As a % of Total Credit(1)
Non-Performing Assets
As a % of Total Loans and Leases and Other Real Estate
Total Automobile(2)
Residential Mortgage/Home Equity
(1) Percent of total credit exposure (total loans and
leases + operating leases + securitized loans)
(2) Total automobile loans and leases + operating
leases + securitized loans
33%
22%
35%
21%
0.60% 0.46%
8
1.23%
0.74%
0.41%
12/00 12/01 12/02 12/03 12/0412/02 6/03 12/03 6/04 12/04
Why It Matters
Going Forward