Honeywell 2015 Annual Report Download - page 45
Download and view the complete annual report
Please find page 45 of the 2015 Honeywell annual report below. You can navigate through the pages in the report by either clicking on the pages listed below, or by using the keyword search tool below to find specific information within the annual report.-
 1
1 -
2
-
3
-
4
-
5
-
6
-
7
-
8
-
9
-
10
-
11
-
12
-
13
-
14
-
15
-
16
-
17
-
18
-
19
-
20
-
21
-
22
-
23
-
24
-
25
-
26
-
27
-
28
-
29
-
30
-
31
-
32
-
33
-
34
-
 35
35 -
 36
36 -
 37
37 -
 38
38 -
 39
39 -
 40
40 -
 41
41 -
 42
42 -
 43
43 -
 44
44 -
 45
45 -
 46
46 -
 47
47 -
 48
48 -
 49
49 -
 50
50 -
 51
51 -
 52
52 -
 53
53 -
 54
54 -
 55
55 -
56
-
57
-
58
-
59
-
60
-
61
-
62
-
63
-
64
-
65
-
66
-
67
-
68
-
69
-
70
-
71
-
72
-
73
-
74
-
75
-
76
-
77
-
78
-
79
-
80
-
81
-
82
-
83
-
84
-
85
-
86
-
87
-
88
-
89
-
90
-
91
-
92
-
93
-
94
-
95
-
96
-
97
-
98
-
99
-
100
-
101
-
102
-
103
-
104
-
105
-
106
-
107
-
108
-
109
-
110
 |
 |

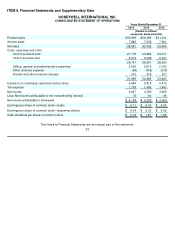
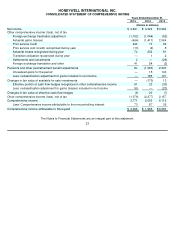
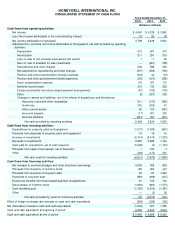
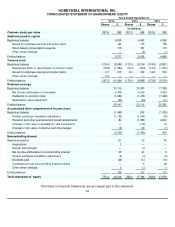
HONEYWELL INTERNATIONAL INC.
NOTES TO FINANCIAL STATEMENTS
—(Continued)
(Dollars in millions, except per share amounts)
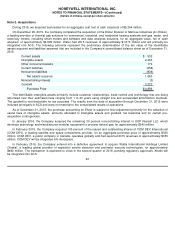
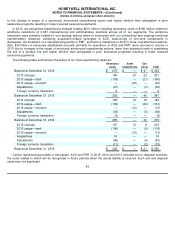
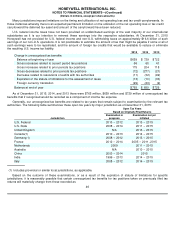
Note 3. Repositioning and Other Charges
A summary of repositioning and other charges follows:
The following table summarizes the pretax distribution of total net repositioning and other charges by income statement
classification:
The following table summarizes the pretax impact of total net repositioning and other charges by segment:
In 2015, we recognized repositioning charges totaling $216 million including severance costs of $197 million related to
workforce reductions of 6,405 manufacturing and administrative positions across all of our segments. The workforce
reductions were primarily related to cost savings actions taken in connection with our productivity and ongoing functional
transformation initiatives. Also, $53 million of previously established accruals, primarily for severance, mainly in Aerospace
and ACS, were returned to income in 2015 due principally to higher attrition than anticipated in prior severance programs
resulting in lower required severance payments, and changes in scope of previously announced repositioning actions.
In 2014, we recognized repositioning charges totaling $184 million including severance costs of $156 million related to
workforce reductions of 2,975 manufacturing and administrative positions across all of our segments. The workforce
reductions were primarily related to cost savings actions taken in connection with our productivity and ongoing functional
transformation initiatives, factory transitions in ACS and Aerospace to more cost-effective locations, and site consolidations
and organizational realignments of businesses in ACS and PMT. Also, $38 million of previously established accruals,
primarily for severance, mainly in Aerospace and ACS, were returned to income in 2014 due principally
41
Years Ended December
31,
2015
2014
2013
Severance
$
197
$
156
$
186
Asset impairments
13
12
23
Exit costs
6
16
22
Reserve adjustments
(53
)
(38
)
(30
)
Total net repositioning charge
163
146
201
Asbestos related litigation charges, net of insurance
189
182
181
Probable and reasonably estimable environmental liabilities
194
268
272
Other
—
2
9
Total net repositioning and other charges
$
546
$
598
$
663
Years Ended December
31,
2015
2014
2013
Cost of products and services sold
$
483
$
525
$
566
Selling, general and administrative expenses
63
73
97
$
546
$
598
$
663
Years Ended December
31,
2015
2014
2013
Aerospace
$
211
$
193
$
235
Automation and Control Solutions
77
80
68
Performance Materials and Technologies
40
33
56
Corporate
218
292
304
$
546
$
598
$
663