Honeywell 2015 Annual Report Download - page 32
Download and view the complete annual report
Please find page 32 of the 2015 Honeywell annual report below. You can navigate through the pages in the report by either clicking on the pages listed below, or by using the keyword search tool below to find specific information within the annual report.-
 1
1 -
2
-
3
-
4
-
5
-
6
-
7
-
8
-
9
-
10
-
11
-
12
-
13
-
14
-
15
-
16
-
17
-
18
-
19
-
20
-
21
-
 22
22 -
 23
23 -
 24
24 -
 25
25 -
 26
26 -
 27
27 -
 28
28 -
 29
29 -
 30
30 -
 31
31 -
 32
32 -
 33
33 -
 34
34 -
 35
35 -
 36
36 -
 37
37 -
 38
38 -
 39
39 -
 40
40 -
 41
41 -
 42
42 -
43
-
44
-
45
-
46
-
47
-
48
-
49
-
50
-
51
-
52
-
53
-
54
-
55
-
56
-
57
-
58
-
59
-
60
-
61
-
62
-
63
-
64
-
65
-
66
-
67
-
68
-
69
-
70
-
71
-
72
-
73
-
74
-
75
-
76
-
77
-
78
-
79
-
80
-
81
-
82
-
83
-
84
-
85
-
86
-
87
-
88
-
89
-
90
-
91
-
92
-
93
-
94
-
95
-
96
-
97
-
98
-
99
-
100
-
101
-
102
-
103
-
104
-
105
-
106
-
107
-
108
-
109
-
110
 |
 |

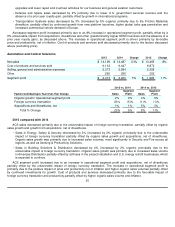
various assumptions used to value our pension plans or when assumptions change. The primary factors contributing to
actuarial gains and losses are changes in the discount rate used to value pension obligations as of the measurement date
each year and the difference between expected and actual returns on plan assets. The mark-to-market accounting method
results in the potential for volatile and difficult to forecast MTM Adjustments. MTM charges were $67 million, $249 million and
$51 million in 2015, 2014 and 2013.
We determine the expected long-term rate of return on plan assets utilizing historical plan asset returns over varying
long-term periods combined with our expectations of future market conditions and asset mix considerations (see Note 20
Pension and Other Postretirement Benefits of Notes to Financial Statements for details on the actual various asset classes
and targeted asset allocation percentages for our pension plans). We plan to continue to use an expected rate of return on
plan assets of 7.75% for 2016 as this is a long-term rate based on historical plan asset returns over varying long term
periods combined with our expectations of future market conditions and the asset mix of the plan
’
s investments.
The discount rate reflects the market rate on December 31 (measurement date) for high-quality fixed-income
investments with maturities corresponding to our benefit obligations and is subject to change each year. The discount rate
can be volatile from year to year as it is determined based upon prevailing interest rates as of the measurement date. We
will use a 4.46% discount rate as of December 31, 2015, reflecting the increase in the market interest rate environment
since the prior year-end.
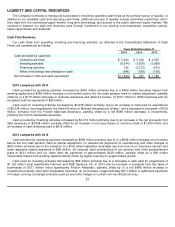
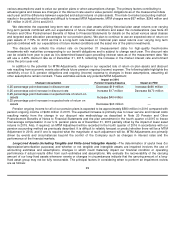
In addition to the potential for MTM Adjustments, changes in our expected rate of return on plan assets and discount
rate resulting from economic events also affects future pension ongoing (income) expense. The following table highlights the
sensitivity of our U.S. pension obligations and ongoing (income) expense to changes in these assumptions, assuming all
other assumptions remain constant. These estimates exclude any potential MTM Adjustment:
Pension ongoing income for all of our pension plans is expected to be approximately $580 million in 2016 compared with
pension ongoing income of $430 million in 2015. The expected increase is primarily due to lower service and interest costs
resulting mainly from the change in our discount rate methodology as described in Note 20 Pension and Other
Postretirement Benefits of Notes to Financial Statements and the plan amendment in the fourth quarter of 2015 to freeze
final average compensation in our U.S. pension plans as of December 31, 2015 partially offset by the impact of lower asset
returns in 2015. Also, if required, an MTM Adjustment will be recorded in the fourth quarter of 2016 in accordance with our
pension accounting method as previously described. It is difficult to reliably forecast or predict whether there will be a MTM
Adjustment in 2016, and if one is required what the magnitude of such adjustment will be. MTM Adjustments are primarily
driven by events and circumstances beyond the control of the Company such as changes in interest rates and the
performance of the financial markets.
Long
-Lived Assets (including Tangible and Finite-Lived Intangible Assets)—The determination of useful lives (for
depreciation/amortization purposes) and whether or not tangible and intangible assets are impaired involves the use of
accounting estimates and assumptions, changes in which could materially impact our financial condition or operating
performance if actual results differ from such estimates and assumptions. We evaluate the recoverability of the carrying
amount of our long-lived assets whenever events or changes in circumstances indicate that the carrying amount of a long-
lived asset group may not be fully recoverable. The principal factors in considering when to perform an impairment review
are as follows:
29
Change in Assumption
Impact on 2016
Pension Ongoing Expense
Impact on PBO
0.25 percentage point decrease in discount rate
Decrease $19 million
Increase $490 million
0.25 percentage point increase in discount rate
Increase $17 million
Decrease $470 million
0.25 percentage point decrease in expected rate of return on
assets
Increase $40 million
—
0.25 percentage point increase in expected rate of return on
assets
Decrease $40 million
—