Honeywell 2015 Annual Report Download - page 20
Download and view the complete annual report
Please find page 20 of the 2015 Honeywell annual report below. You can navigate through the pages in the report by either clicking on the pages listed below, or by using the keyword search tool below to find specific information within the annual report.-
 1
1 -
2
-
3
-
4
-
5
-
6
-
7
-
8
-
9
-
 10
10 -
 11
11 -
 12
12 -
 13
13 -
 14
14 -
 15
15 -
 16
16 -
 17
17 -
 18
18 -
 19
19 -
 20
20 -
 21
21 -
 22
22 -
 23
23 -
 24
24 -
 25
25 -
 26
26 -
 27
27 -
 28
28 -
 29
29 -
 30
30 -
31
-
32
-
33
-
34
-
35
-
36
-
37
-
38
-
39
-
40
-
41
-
42
-
43
-
44
-
45
-
46
-
47
-
48
-
49
-
50
-
51
-
52
-
53
-
54
-
55
-
56
-
57
-
58
-
59
-
60
-
61
-
62
-
63
-
64
-
65
-
66
-
67
-
68
-
69
-
70
-
71
-
72
-
73
-
74
-
75
-
76
-
77
-
78
-
79
-
80
-
81
-
82
-
83
-
84
-
85
-
86
-
87
-
88
-
89
-
90
-
91
-
92
-
93
-
94
-
95
-
96
-
97
-
98
-
99
-
100
-
101
-
102
-
103
-
104
-
105
-
106
-
107
-
108
-
109
-
110
 |
 |

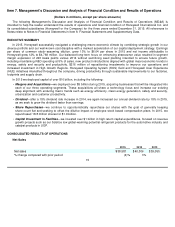
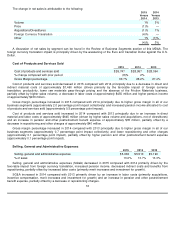
Tax Expense
For discussion of changes in the effective tax rate, see Note 5 Income Taxes in the Notes to Financial Statements.
The effective tax rates for 2015, 2014 and 2013 are lower than the U.S. statutory rate of 35% primarily due to lower tax
rates on non-U.S. earnings, the vast majority of which we intend to permanently reinvest outside the United States.
The Company currently expects the effective tax rate for 2016 to be approximately 26.5%. The effective tax rate can
vary from quarter to quarter due to unusual or infrequently occurring items, the resolution of income tax audits, changes in
tax laws or other items such as pension mark-to-market adjustments.
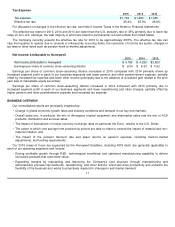
Net Income Attributable to Honeywell
Earnings per share of common stock–assuming dilution increased in 2015 compared with 2014 primarily driven by
increased segment profit in each of our business segments and lower pension and other postretirement expense, partially
offset by increased tax expense and lower other income (principally due to the absence of a realized gain related to the prior
year sale of marketable equity securities).
Earnings per share of common stock–assuming dilution increased in 2014 compared with 2013 primarily due to
increased segment profit in each of our business segments and lower repositioning and other charges, partially offset by
higher pension and other postretirement expense and increased tax expense.
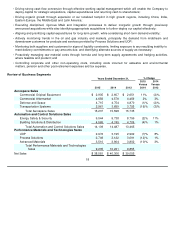
BUSINESS OVERVIEW
Our consolidated results are principally impacted by:
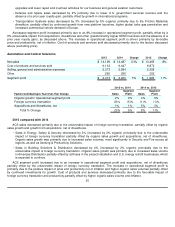
Our 2016 areas of focus are supported by the Honeywell Enablers, including HOS Gold, are generally applicable to
each of our operating segments and include:
17
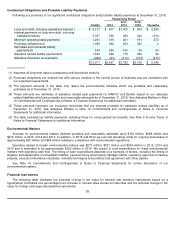
2015
2014
2013
Tax expense
$
1,739
$
1,489
$
1,450
Effective tax rate
26.4
%
25.6
%
26.8
%
2015
2014
2013
Net income attributable to Honeywell
$
4,768
$
4,239
$
3,924
Earnings per share of common stock–assuming dilution
$
6.04
$
5.33
$
4.92
•
Change in global economic growth rates and industry conditions and demand in our key end markets;
•
Overall sales mix, in particular the mix of Aerospace original equipment and aftermarket sales and the mix of ACS
products, distribution and services sales;
•
The impact of fluctuations in foreign currency exchange rates (in particular the Euro), relative to the U.S. Dollar;
•
The extent to which cost savings from productivity actions are able to offset or exceed the impact of material and non-
material inflation; and
•
The impact of the pension discount rate and asset returns on pension expense, including mark-to-market
adjustments, and funding requirements.
•
Driving profitable growth through R&D, technological excellence and optimized manufacturing capability to deliver
innovative products that customers value;
•
Expanding margins by maintaining and improving the Company
’
s cost structure through manufacturing and
administrative process improvements, repositioning, and other actions, which will drive productivity and enhance the
flexibility of the business as it works to proactively respond to changes in end market demand;