Honeywell 2015 Annual Report Download - page 23
Download and view the complete annual report
Please find page 23 of the 2015 Honeywell annual report below. You can navigate through the pages in the report by either clicking on the pages listed below, or by using the keyword search tool below to find specific information within the annual report.-
 1
1 -
2
-
3
-
4
-
5
-
6
-
7
-
8
-
9
-
10
-
11
-
12
-
 13
13 -
 14
14 -
 15
15 -
 16
16 -
 17
17 -
 18
18 -
 19
19 -
 20
20 -
 21
21 -
 22
22 -
 23
23 -
 24
24 -
 25
25 -
 26
26 -
 27
27 -
 28
28 -
 29
29 -
 30
30 -
 31
31 -
 32
32 -
 33
33 -
34
-
35
-
36
-
37
-
38
-
39
-
40
-
41
-
42
-
43
-
44
-
45
-
46
-
47
-
48
-
49
-
50
-
51
-
52
-
53
-
54
-
55
-
56
-
57
-
58
-
59
-
60
-
61
-
62
-
63
-
64
-
65
-
66
-
67
-
68
-
69
-
70
-
71
-
72
-
73
-
74
-
75
-
76
-
77
-
78
-
79
-
80
-
81
-
82
-
83
-
84
-
85
-
86
-
87
-
88
-
89
-
90
-
91
-
92
-
93
-
94
-
95
-
96
-
97
-
98
-
99
-
100
-
101
-
102
-
103
-
104
-
105
-
106
-
107
-
108
-
109
-
110
 |
 |

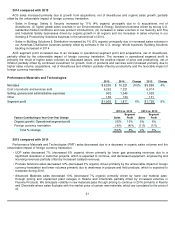
Aerospace segment profit increased primarily due to an 8% increase in operational segment profit, partially offset by a
6% unfavorable impact from acquisitions, divestitures and other (predominantly higher OEM Incentives and the absence of a
prior year royalty gain), as discussed above. The increase in operational segment profit is driven primarily by favorable
price and productivity, net of inflation. Cost of products and services sold decreased primarily due to the factors discussed
above (excluding price).
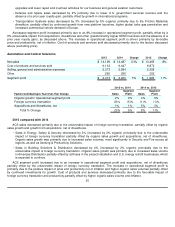
Automation and Control Solutions
2015 compared with 2014
ACS sales decreased primarily due to the unfavorable impact of foreign currency translation, partially offset by organic
sales growth and growth from acquisitions, net of divestitures.
ACS segment profit increased due to an increase in operational segment profit and acquisitions, net of divestitures
partially offset by the unfavorable impact of foreign currency translation. The increase in operational segment profit is
primarily due to the positive impact of price and productivity net of inflation and higher organic sales volumes partially offset
by continued investments for growth. Cost of products and services decreased primarily due to the favorable impact of
foreign currency translation and productivity partially offset by higher organic sales volume and inflation.
20
upgrades and lower repair and overhaul activities for our business and general aviation customers.
•
Defense and Space sales decreased by 2% primarily due to lower U.S. government services revenue and the
absence of a prior year royalty gain, partially offset by growth in international programs.
•
Transportation Systems sales decreased by 3% (increased by 5% organic) primarily due to the Friction Materials
divestiture, partially offset by continued growth from new platform launches, higher global turbo gas penetration and
increased commercial vehicle demand in Europe.
2015
2014
Change
2013
Change
Net sales
$
14,109
$
14,487
(3
)%
$
13,465
8
%
Cost of products and services sold
9,133
9,447
8,872
Selling, general and administrative expenses
2,373
2,584
2,358
Other
290
256
252
Segment profit
$
2,313
$
2,200
5
%
$
1,983
11
%
Factors Contributing to Year
-Over-Year Change
2015 vs. 2014
2014 vs. 2013
Sales
Segment
Profit
Sales
Segment
Profit
Organic growth/ Operational segment profit
2
%
9
%
4
%
9
%
Foreign currency translation
(6
)%
(5
)%
(1
)%
(1
)%
Acquisitions and divestitures, net
1
%
1
%
5
%
3
%
Total % Change
(3
)%
5
%
8
%
11
%
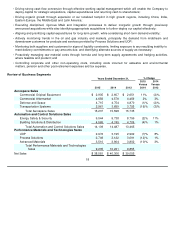
•
Sales in Energy, Safety & Security decreased by 2% (increased by 2% organic) principally due to the unfavorable
impact of foreign currency translation partially offset by organic sales growth and acquisitions, net of divestitures.
Organic sales growth was primarily due to increased sales volumes, most significantly in Security and Fire across all
regions, as well as Sensing & Productivity Solutions.
•
Sales in Building Solutions & Distribution decreased by 4% (increased by 2% organic) principally due to the
unfavorable impact of foreign currency translation. Organic sales growth was primarily due to increased sales volume
in Americas Distribution partially offset by softness in the project installation and U.S. energy retrofit businesses, which
is expected to continue.