Honeywell 2015 Annual Report Download - page 21
Download and view the complete annual report
Please find page 21 of the 2015 Honeywell annual report below. You can navigate through the pages in the report by either clicking on the pages listed below, or by using the keyword search tool below to find specific information within the annual report.-
 1
1 -
2
-
3
-
4
-
5
-
6
-
7
-
8
-
9
-
10
-
 11
11 -
 12
12 -
 13
13 -
 14
14 -
 15
15 -
 16
16 -
 17
17 -
 18
18 -
 19
19 -
 20
20 -
 21
21 -
 22
22 -
 23
23 -
 24
24 -
 25
25 -
 26
26 -
 27
27 -
 28
28 -
 29
29 -
 30
30 -
 31
31 -
32
-
33
-
34
-
35
-
36
-
37
-
38
-
39
-
40
-
41
-
42
-
43
-
44
-
45
-
46
-
47
-
48
-
49
-
50
-
51
-
52
-
53
-
54
-
55
-
56
-
57
-
58
-
59
-
60
-
61
-
62
-
63
-
64
-
65
-
66
-
67
-
68
-
69
-
70
-
71
-
72
-
73
-
74
-
75
-
76
-
77
-
78
-
79
-
80
-
81
-
82
-
83
-
84
-
85
-
86
-
87
-
88
-
89
-
90
-
91
-
92
-
93
-
94
-
95
-
96
-
97
-
98
-
99
-
100
-
101
-
102
-
103
-
104
-
105
-
106
-
107
-
108
-
109
-
110
 |
 |

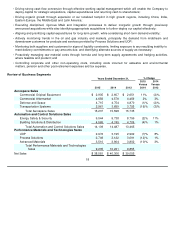
Review of Business Segments
18
•
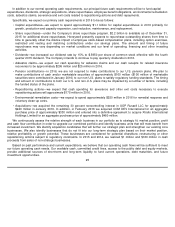
Driving strong cash flow conversion through effective working capital management which will enable the Company to
deploy capital for strategic acquisitions, capital expenditures and returning cash to shareholders;
•
Driving organic growth through expansion of our localized footprint in high growth regions, including China, India,
Eastern Europe, the Middle East and Latin America;
•
Executing disciplined, rigorous M&A and integration processes to deliver inorganic growth through previously
announced acquisitions while also identifying appropriate acquisitions to further deploy our capital effectively;
•
Aligning and prioritizing capital expenditures for long-term growth, while considering short-term demand volatility;
•
Actively monitoring trends in the oil and gas industry end markets, principally the demand from midstream and
downstream customers for products and services provided by Process Solutions and UOP;
•
Monitoring both suppliers and customers for signs of liquidity constraints, limiting exposure to any resultjing inability to
meet delivery commitments or pay amounts due, and identifying alternate sources of supply as necessary;
•
Proactively managing raw material costs through formula and long-term supply agreements and hedging activities,
where feasible and prudent; and
•
Controlling corporate and other non-operating costs, including costs incurred for asbestos and environmental
matters, pension and other post-retirement expenses and tax expense.
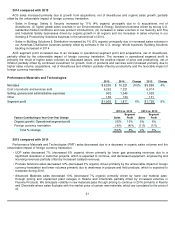
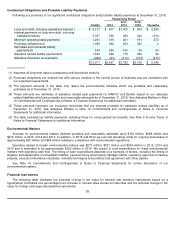
Years Ended December 31,
% Change
2015
Versus
2014
2014
Versus
2013
2015
2014
2013
Aerospace Sales
Commercial Original Equipment
$
2,905
$
2,607
$
2,651
11
%
(2
)%
Commercial Aftermarket
4,656
4,578
4,459
2
%
3
%
Defense and Space
4,715
4,754
4,870
(1
)%
(2
)%
Transportation Systems
2,961
3,659
3,755
(19
)%
(3
)%
Total Aerospace Sales
15,237
15,598
15,735
Automation and Control Solutions Sales
Energy Safety & Security
9,544
9,738
8,756
(2
)%
11
%
Building Solutions & Distribution
4,565
4,749
4,709
(4
)%
1
%
Total Automation and Control Solutions Sales
14,109
14,487
13,465
Performance Materials and Technologies Sales
UOP
2,976
3,195
2,962
(7
)%
8
%
Process Solutions
2,749
3,122
3,091
(12
)%
1
%
Advanced Materials
3,510
3,904
3,802
(10
)%
3
%
Total Performance Materials and Technologies
Sales
9,235
10,221
9,855
Net Sales
$
38,581
$
40,306
$
39,055