Honeywell 2014 Annual Report Download - page 66
Download and view the complete annual report
Please find page 66 of the 2014 Honeywell annual report below. You can navigate through the pages in the report by either clicking on the pages listed below, or by using the keyword search tool below to find specific information within the annual report.-
 1
1 -
2
-
3
-
4
-
5
-
6
-
7
-
8
-
9
-
10
-
11
-
12
-
13
-
14
-
15
-
16
-
17
-
18
-
19
-
20
-
21
-
22
-
23
-
24
-
25
-
26
-
27
-
28
-
29
-
30
-
31
-
32
-
33
-
34
-
35
-
36
-
37
-
38
-
39
-
40
-
41
-
42
-
43
-
44
-
45
-
46
-
47
-
48
-
49
-
50
-
51
-
52
-
53
-
54
-
55
-
 56
56 -
 57
57 -
 58
58 -
 59
59 -
 60
60 -
 61
61 -
 62
62 -
 63
63 -
 64
64 -
 65
65 -
 66
66 -
 67
67 -
 68
68 -
 69
69 -
 70
70 -
 71
71 -
 72
72 -
 73
73 -
 74
74 -
 75
75 -
 76
76 -
77
-
78
-
79
-
80
-
81
-
82
-
83
-
84
-
85
-
86
-
87
-
88
-
89
-
90
-
91
-
92
-
93
-
94
-
95
-
96
-
97
-
98
-
99
-
100
-
101
 |
 |

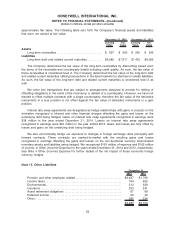
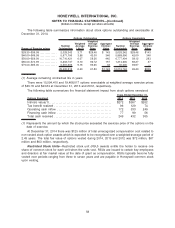
The fair value of each option award is estimated on the date of grant using the Black-Scholes
option-pricing model. Expected volatility is based on implied volatilities from traded options on our
common stock and historical volatility of our common stock. We used a Monte Carlo simulation model
to derive an expected term which represents an estimate of the time options are expected to remain
outstanding. Such model uses historical data to estimate option exercise activity and post-vest
termination behavior. The risk-free rate for periods within the contractual life of the option is based on
the U.S. treasury yield curve in effect at the time of grant.
Compensation cost on a pre-tax basis related to stock options recognized in selling, general and
administrative expenses in 2014, 2013 and 2012 was $85 million, $70 million and $65 million,
respectively. The associated future income tax benefit recognized in 2014, 2013 and 2012 was $31
million, $24 million and $23 million, respectively.
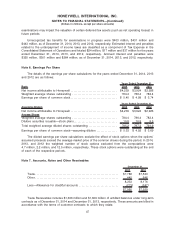
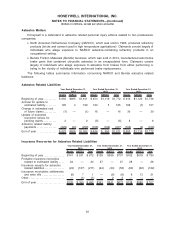
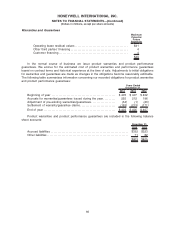
The following table sets forth fair value per share information, including related weighted-average
assumptions, used to determine compensation cost:
2014 2013 2012
Years Ended December 31,
Weighted average fair value per share of options granted
during the year(1) . . . . . . . . . . . . . . . . . . . . . . . . . . . . . . . . . . . . . . . $16.35 $11.85 $13.26
Assumptions:
Expected annual dividend yield. . . . . . . . . . . . . . . . . . . . . . . . . 2.05% 2.55% 2.57%
Expected volatility . . . . . . . . . . . . . . . . . . . . . . . . . . . . . . . . . . . . . 23.06% 24.73% 30.36%
Risk-free rate of return. . . . . . . . . . . . . . . . . . . . . . . . . . . . . . . . . 1.48% 0.91% 1.16%
Expected option term (years). . . . . . . . . . . . . . . . . . . . . . . . . . . 5.0 5.5 5.8
(1) Estimated on date of grant using Black-Scholes option-pricing model.
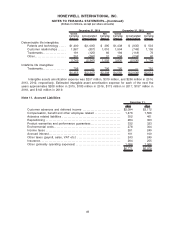
The following table summarizes information about stock option activity for the three years ended
December 31, 2014:
Number of
Options
Weighted
Average
Exercise
Price
Outstanding at December 31, 2011 . . . . . . . . . . . . . . . . . . . . . . . . . . . . . . . . . . . . . 38,916,370 $43.01
Granted. . . . . . . . . . . . . . . . . . . . . . . . . . . . . . . . . . . . . . . . . . . . . . . . . . . . . . . . . . . . 5,788,734 59.86
Exercised . . . . . . . . . . . . . . . . . . . . . . . . . . . . . . . . . . . . . . . . . . . . . . . . . . . . . . . . . . (8,347,313) 36.52
Lapsed or canceled . . . . . . . . . . . . . . . . . . . . . . . . . . . . . . . . . . . . . . . . . . . . . . . . (788,770) 49.76
Outstanding at December 31, 2012 . . . . . . . . . . . . . . . . . . . . . . . . . . . . . . . . . . . . . 35,569,021 47.13
Granted. . . . . . . . . . . . . . . . . . . . . . . . . . . . . . . . . . . . . . . . . . . . . . . . . . . . . . . . . . . . 6,041,422 69.89
Exercised . . . . . . . . . . . . . . . . . . . . . . . . . . . . . . . . . . . . . . . . . . . . . . . . . . . . . . . . . . (10,329,611) 41.91
Lapsed or canceled . . . . . . . . . . . . . . . . . . . . . . . . . . . . . . . . . . . . . . . . . . . . . . . . (616,995) 53.84
Outstanding at December 31, 2013 . . . . . . . . . . . . . . . . . . . . . . . . . . . . . . . . . . . . . 30,663,837 53.27
Granted. . . . . . . . . . . . . . . . . . . . . . . . . . . . . . . . . . . . . . . . . . . . . . . . . . . . . . . . . . . . 5,823,706 93.95
Exercised . . . . . . . . . . . . . . . . . . . . . . . . . . . . . . . . . . . . . . . . . . . . . . . . . . . . . . . . . . (5,697,263) 47.47
Lapsed or canceled . . . . . . . . . . . . . . . . . . . . . . . . . . . . . . . . . . . . . . . . . . . . . . . . (1,294,668) 67.70
Outstanding at December 31, 2014 . . . . . . . . . . . . . . . . . . . . . . . . . . . . . . . . . . . . . 29,495,612 $61.80
Vested and expected to vest at December 31, 2014(1). . . . . . . . . . . . . . . . . . . 28,015,623 $60.44
Exercisable at December 31, 2014 . . . . . . . . . . . . . . . . . . . . . . . . . . . . . . . . . . . . . . 16,019,742 $49.40
(1) Represents the sum of vested options of 16.0 million and expected to vest options of 12.0 million.
Expected to vest options are derived by applying the pre-vesting forfeiture rate assumption to total
outstanding unvested options of 28.0 million.
57
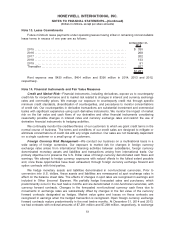
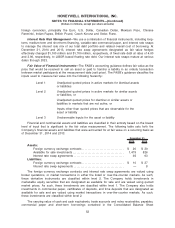
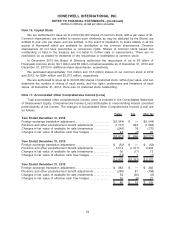
HONEYWELL INTERNATIONAL INC.
NOTES TO FINANCIAL STATEMENTS—(Continued)
(Dollars in millions, except per share amounts)