Hasbro 2013 Annual Report Download - page 64
Download and view the complete annual report
Please find page 64 of the 2013 Hasbro annual report below. You can navigate through the pages in the report by either clicking on the pages listed below, or by using the keyword search tool below to find specific information within the annual report.-
 1
1 -
2
-
3
-
4
-
5
-
6
-
7
-
8
-
9
-
10
-
11
-
12
-
13
-
14
-
15
-
16
-
17
-
18
-
19
-
20
-
21
-
22
-
23
-
24
-
25
-
26
-
27
-
28
-
29
-
30
-
31
-
32
-
33
-
34
-
35
-
36
-
37
-
38
-
39
-
40
-
41
-
42
-
43
-
44
-
45
-
46
-
47
-
48
-
49
-
50
-
51
-
52
-
53
-
 54
54 -
 55
55 -
 56
56 -
 57
57 -
 58
58 -
 59
59 -
 60
60 -
 61
61 -
 62
62 -
 63
63 -
 64
64 -
 65
65 -
 66
66 -
 67
67 -
 68
68 -
 69
69 -
 70
70 -
 71
71 -
 72
72 -
 73
73 -
 74
74 -
75
-
76
-
77
-
78
-
79
-
80
-
81
-
82
-
83
-
84
-
85
-
86
-
87
-
88
-
89
-
90
-
91
-
92
-
93
-
94
-
95
-
96
-
97
-
98
-
99
-
100
-
101
-
102
-
103
-
104
-
105
-
106
-
107
-
108
-
109
-
110
-
111
-
112
-
113
-
114
-
115
-
116
-
117
-
118
-
119
-
120
 |
 |

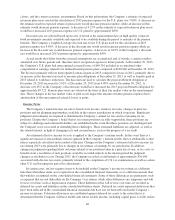
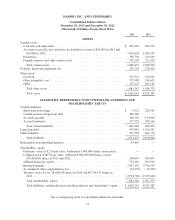
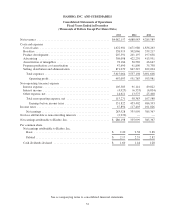
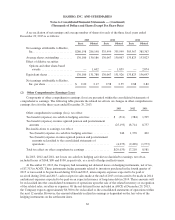
HASBRO, INC. AND SUBSIDIARIES
Consolidated Statements of Operations
Fiscal Years Ended in December
(Thousands of Dollars Except Per Share Data)
2013 2012 2011
Net revenues ................................................. $4,082,157 4,088,983 4,285,589
Costs and expenses
Cost of sales ............................................... 1,672,901 1,671,980 1,836,263
Royalties .................................................. 338,919 302,066 339,217
Product development ......................................... 207,591 201,197 197,638
Advertising ................................................ 398,098 422,239 413,951
Amortization of intangibles .................................... 78,186 50,569 46,647
Program production cost amortization ........................... 47,690 41,800 35,798
Selling, distribution and administration .......................... 871,679 847,347 822,094
Total expenses ............................................ 3,615,064 3,537,198 3,691,608
Operating profit ......................................... 467,093 551,785 593,981
Non-operating (income) expense
Interest expense ............................................. 105,585 91,141 89,022
Interest income ............................................. (4,925) (6,333) (6,834)
Other expense, net ........................................... 14,611 13,575 25,400
Total non-operating expense, net ............................. 115,271 98,383 107,588
Earnings before income taxes .............................. 351,822 453,402 486,393
Income taxes ................................................. 67,894 117,403 101,026
Net earnings .............................................. 283,928 335,999 385,367
Net loss attributable to noncontrolling interests ...................... (2,270) — —
Net earnings attributable to Hasbro, Inc. ........................... $ 286,198 335,999 385,367
Per common share
Net earnings attributable to Hasbro, Inc.
Basic ................................................... $ 2.20 2.58 2.88
Diluted .................................................. $ 2.17 2.55 2.82
Cash dividends declared ...................................... $ 1.60 1.44 1.20
See accompanying notes to consolidated financial statements.
52