Hasbro 2013 Annual Report Download - page 10
Download and view the complete annual report
Please find page 10 of the 2013 Hasbro annual report below. You can navigate through the pages in the report by either clicking on the pages listed below, or by using the keyword search tool below to find specific information within the annual report.-
 1
1 -
 2
2 -
 3
3 -
 4
4 -
 5
5 -
 6
6 -
 7
7 -
 8
8 -
 9
9 -
 10
10 -
 11
11 -
 12
12 -
 13
13 -
 14
14 -
 15
15 -
 16
16 -
 17
17 -
 18
18 -
 19
19 -
 20
20 -
 21
21 -
22
-
23
-
24
-
25
-
26
-
27
-
28
-
29
-
30
-
31
-
32
-
33
-
34
-
35
-
36
-
37
-
38
-
39
-
40
-
41
-
42
-
43
-
44
-
45
-
46
-
47
-
48
-
49
-
50
-
51
-
52
-
53
-
54
-
55
-
56
-
57
-
58
-
59
-
60
-
61
-
62
-
63
-
64
-
65
-
66
-
67
-
68
-
69
-
70
-
71
-
72
-
73
-
74
-
75
-
76
-
77
-
78
-
79
-
80
-
81
-
82
-
83
-
84
-
85
-
86
-
87
-
88
-
89
-
90
-
91
-
92
-
93
-
94
-
95
-
96
-
97
-
98
-
99
-
100
-
101
-
102
-
103
-
104
-
105
-
106
-
107
-
108
-
109
-
110
-
111
-
112
-
113
-
114
-
115
-
116
-
117
-
118
-
119
-
120
 |
 |
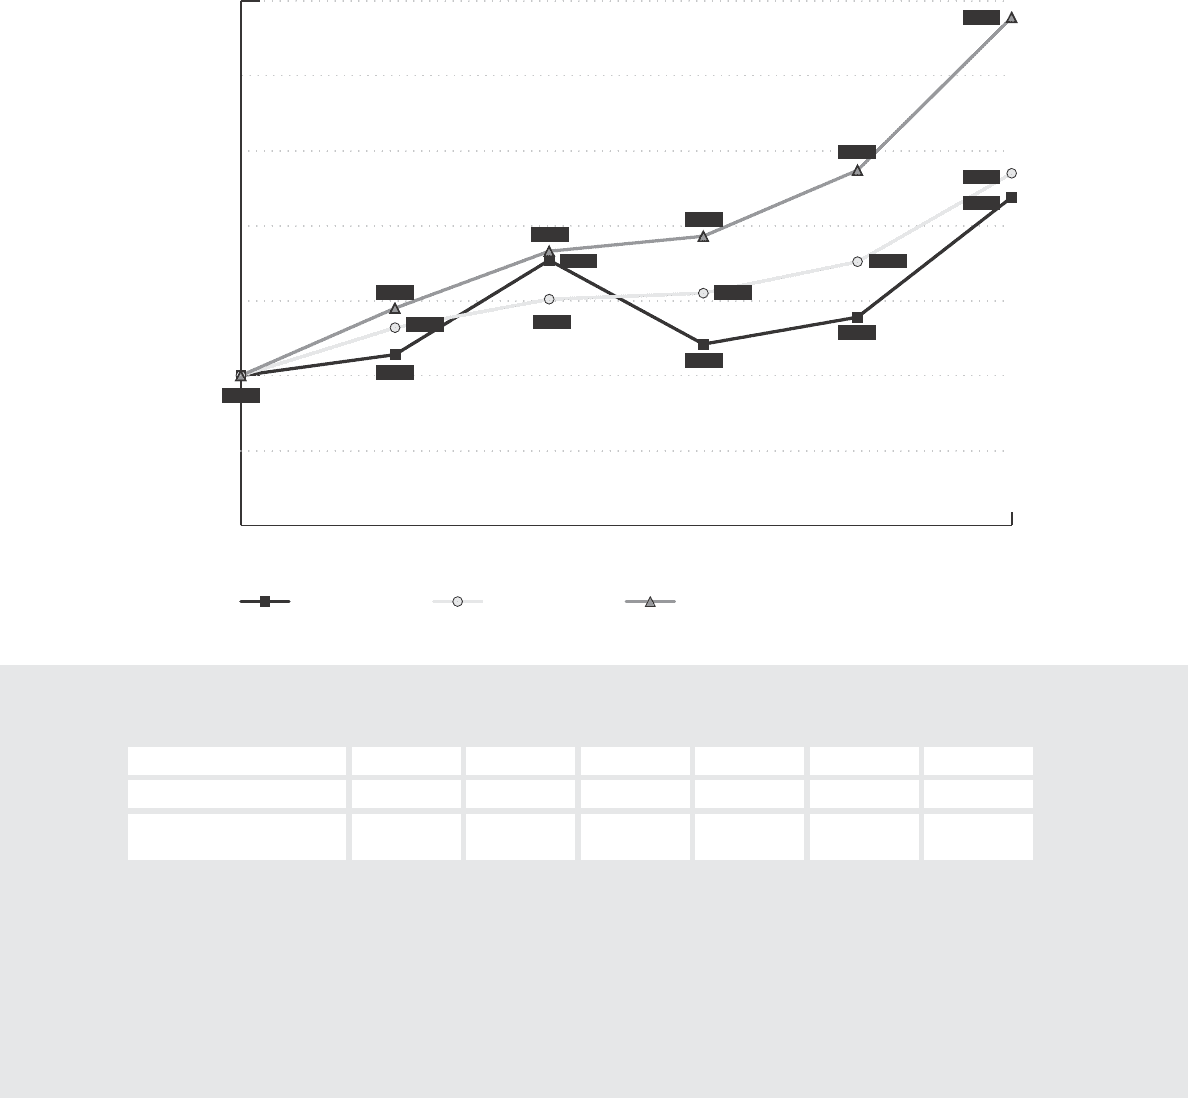
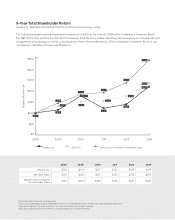
5-Year Total Shareholder Return
Hasbro vs. S&P 500 and Russell 1000 Consumer Discretionary Index
The following graph tracks an assumed investment of $100 at the end of 2008 in the Company’s Common Stock,
the S&P 500 Index and the Russell 1000 Consumer Discretionary Index, assuming full reinvestment of dividends and
no payment of brokerage or other commissions or fees. Past performance of the Company’s Common Stock is not
necessarily indicative of future performance.
Indexed Stock Price
$0
$50
$100
$150
$200
$250
$300
$350
Russell 1000 Consumer Discretionary IndexS&P 500Hasbro, Inc.
201320122011201020092008
Note: Data reflects Hasbro’s fiscal year ends.
Source: Data provided by Zacks Investment Research, Inc. Used with permission. All rights reserved. Copyright 1980-2014
Index Data: Copyright Standard and Poor’s, Inc. Used with permission. All rights reserved.
Index Data: Copyright Russell Investments. Used with permission. All rights reserved.
$100
$132
$114
$183
$193
$237
$339
$219
$235
$138
$176
$121
$155$145
$177
$151
2008 2009 2010 2011 2012 2013
Hasbro, Inc. $10 0 $114 $17 7 $121 $138 $219
S&P 500 Index $10 0 $132 $151 $155 $176 $235
Russell 1000 Consumer
Discretionary Index $100 $145 $183 $193 $237 $339