Hasbro 2013 Annual Report Download - page 51
Download and view the complete annual report
Please find page 51 of the 2013 Hasbro annual report below. You can navigate through the pages in the report by either clicking on the pages listed below, or by using the keyword search tool below to find specific information within the annual report.-
 1
1 -
2
-
3
-
4
-
5
-
6
-
7
-
8
-
9
-
10
-
11
-
12
-
13
-
14
-
15
-
16
-
17
-
18
-
19
-
20
-
21
-
22
-
23
-
24
-
25
-
26
-
27
-
28
-
29
-
30
-
31
-
32
-
33
-
34
-
35
-
36
-
37
-
38
-
39
-
40
-
 41
41 -
 42
42 -
 43
43 -
 44
44 -
 45
45 -
 46
46 -
 47
47 -
 48
48 -
 49
49 -
 50
50 -
 51
51 -
 52
52 -
 53
53 -
 54
54 -
 55
55 -
 56
56 -
 57
57 -
 58
58 -
 59
59 -
 60
60 -
 61
61 -
62
-
63
-
64
-
65
-
66
-
67
-
68
-
69
-
70
-
71
-
72
-
73
-
74
-
75
-
76
-
77
-
78
-
79
-
80
-
81
-
82
-
83
-
84
-
85
-
86
-
87
-
88
-
89
-
90
-
91
-
92
-
93
-
94
-
95
-
96
-
97
-
98
-
99
-
100
-
101
-
102
-
103
-
104
-
105
-
106
-
107
-
108
-
109
-
110
-
111
-
112
-
113
-
114
-
115
-
116
-
117
-
118
-
119
-
120
 |
 |

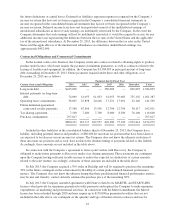
1.4% of net revenues, in 2013 reflecting the addition of Backflip. Increased amortization in 2012 compared to
2011 was the result of higher expense related to certain intangibles that are amortized based on actual and
projected net revenues.
Program production cost amortization increased to $47,690, or 1.2% of net revenues, in 2013 compared to
$41,800, or 1.0% of net revenues, in 2012 and $35,798, or 0.8% of net revenues, in 2011. Program production
costs are capitalized as incurred and amortized using the individual-film-forecast method. Increasing program
production cost amortization reflects the level of revenues associated with television programming as well as the
type of television programs produced and distributed in 2013 compared to 2012 and 2011.
Selling, distribution and administration expenses increased to $871,679, or 21.3% of net revenues, in 2013
compared to $847,347, or 20.7% of net revenues, in 2012 and $822,094, or 19.2% of net revenues, in 2011.
Selling, distribution and administration expense for 2013 includes $32,547 of restructuring and related pension
charges, and legal costs associated with the arbitration settlement while 2012 and 2011 included $33,463 and
$7,641, respectively, of restructuring charges. Excluding these charges, selling, distribution and administration
expense increased to $839,132, or 20.6% of net revenues, in 2013 compared to $813,884, or 19.9% of net
revenues, in 2012 and $814,453, or 19.0% of net revenues, in 2011. The increase in 2013 compared to 2012
reflects investments in emerging markets, information systems, new facilities, and certain brands, including
MAGIC: THE GATHERING and the acquisition of Backflip. Higher compensation and legal expenses also
contributed to the increase in 2013. These investments and higher costs in 2013 more than offset savings,
primarily from headcount reductions, resulting from our cost savings initiatives. Selling, distribution and
administration expense decreased in 2012 compared to 2011 as a result of lower shipping and warehousing costs
related to lower revenues and lower inventory balances. Increased stock compensation and bonus provisions in
2012 compared to 2011 were substantially offset by the favorable impact of currency translation.
Interest Expense
Interest expense increased to $105,585 in 2013 from $91,141 in 2012 and $89,022 in 2011. Interest expense
in 2013 includes approximately $15,090 related to the settlement of an arbitration award. Absent these charges,
interest expense was flat in 2013 compared to 2012. Increased interest expense in 2012 compared to 2011
primarily reflects higher average short-term borrowings as well as the impact of the extra week of interest
expense on long-term debt in the first quarter of 2012 compared to 2011.
Interest Income
Interest income was $4,925 in 2013 compared to $6,333 in 2012 and $6,834 in 2011. Decreased interest
income in 2013 compared to 2012 reflects lower average interest rates. Interest income in 2011 includes
approximately $1,100 in interest received from the U.S. Internal Revenue Service related to prior years. Absent
the impact of this receipt, interest income in 2012 increased compared to 2011 reflecting higher invested cash
balances, primarily in international markets.
Other (Income) Expense, Net
Other (income) expense, net of $14,611 compares to $13,575 in 2012 and $25,400 in 2011. The slight
increase in expense in 2013 compared to 2012 was primarily due to higher net losses on foreign currency
transactions and the impact of investment gains and losses. The decrease in 2012 compared to 2011 is primarily
due to lower net losses on foreign currency transactions as well as gains on investments in 2012 compared to
losses on investments in 2011.
Foreign currency exchange net losses of $5,159 in 2013 compared to $4,178 in 2012 and $8,343 in 2011.
The net loss in 2011 includes $3,700 related to derivative instruments which no longer qualified for hedge
accounting. Investment losses of $1,148 and $4,167 in 2013 and 2011, respectively, compared to investment
gains of $(1,257) in 2012. The losses in 2013 and 2011 primarily relate to warrants to purchase common stock of
an unrelated company. These warrants were exercised and related shares were sold in 2013. Other (income)
expense, net in 2013, 2012 and 2011 includes $2,386, $6,015 and $7,290 respectively, relating to the Company’s
50% share in the loss of Hub Network.
39