Harris Teeter 1998 Annual Report Download - page 4
Download and view the complete annual report
Please find page 4 of the 1998 Harris Teeter annual report below. You can navigate through the pages in the report by either clicking on the pages listed below, or by using the keyword search tool below to find specific information within the annual report.-
 1
1 -
 2
2 -
 3
3 -
 4
4 -
 5
5 -
 6
6 -
 7
7 -
 8
8 -
 9
9 -
 10
10 -
 11
11 -
 12
12 -
 13
13 -
 14
14 -
 15
15 -
16
-
17
-
18
-
19
-
20
-
21
-
22
-
23
 |
 |

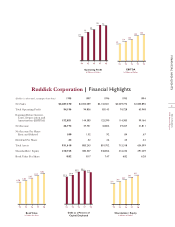
Ruddick Corporation
and Subsidiaries
2
FINANCIAL HIGHLIGHTS
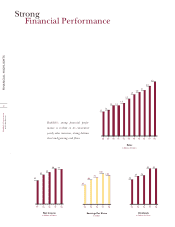
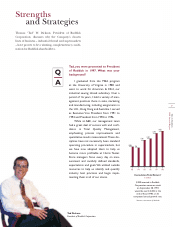
Strong
Financial Performance
94 95 96 97 98
32
39 43
48 47
94 95 96 97 98
.22
.25 .26
.32 .32
Net Income
In Millions of Dollars
Earnings Per Share
In Dollars
Dividends
In Dollars Per Share
94 95 96 97 98
.67
.84
.92
1.02 1.00
Ruddick’s strong financial perfor-
mance is evident in its consecutive
yearly sales increases, strong balance
sheet and growing cash flows. 88 89 90 91 92 93 94 95 96 97 98
1.1 1.2
1.4 1.4
Sales
In Billions of Dollars
1.5
1.7
2.0 2.1
2.3
2.5
1.9