Harris Teeter 1998 Annual Report Download - page 13
Download and view the complete annual report
Please find page 13 of the 1998 Harris Teeter annual report below. You can navigate through the pages in the report by either clicking on the pages listed below, or by using the keyword search tool below to find specific information within the annual report.-
 1
1 -
2
-
 3
3 -
 4
4 -
 5
5 -
 6
6 -
 7
7 -
 8
8 -
 9
9 -
 10
10 -
 11
11 -
 12
12 -
 13
13 -
 14
14 -
 15
15 -
 16
16 -
 17
17 -
 18
18 -
 19
19 -
 20
20 -
 21
21 -
 22
22 -
 23
23
 |
 |

11
This Is Ruddick.
1998 Annual Report
Improving Operating Margins
In fiscal 1998, we were also pleased to
report an increase of 14% in our operating
profit, another critical priority for Harris
Teeter. Our sales per labor hour increased
by nearly 5%, reflecting our continuing
improvement in store productivity. We
measure everything we do, with a goal
of achieving continuous improvement of
our business processes. We are identifying
store and industry best practices, standard-
izing them and measuring compliance. We
then utilize TQM techniques to improve
Operations Overview
Total Sales $2,132,223,000
Associates 17,300
Date Founded 1960
Number of Stores 144 in 5 states
Total Square Footage 5,638,261
Average Weekly Sales Per Store $292,000
even further upon these best practices. We
still have tremendous opportunities to
increase our efficiency per square foot
without sacrificing customer service and
to add significantly, over time, to our
operating profit.
During fiscal 1998, a number of our
specific department initiatives proved very
successful and we saw particular improve-
ment in such areas as dry grocery, dairy,
seafood, meat and health and beauty care.
Continuing to enhance the appeal of our
home meal replacement offerings, making
certain that specific core items are offered
in all stores and improving their profitability
Senior Vice Presidents
Greg Ambro (finance and
administration), Karen
Stout (operations) and
Larry Nivens (merchan-
dising and manufacturing)
work with other mem-
bers of Harris Teeter’s
management team to
continuously improve our
services to customers
and boost the Company’s
profitability.
Stores by State
■North Carolina
■South Carolina
■Virginia
■Georgia
■Tennessee
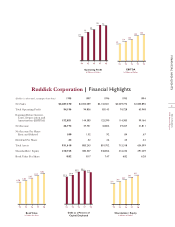
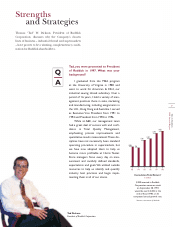
94 95 96 97 98
223 235
259 273
292
Average Weekly
Sales Per Store*
In Thousands of Dollars
* Computed on the basis of aggregate sales
of stores open for a full year.
93
22
9
17
3