Harley Davidson 2015 Annual Report Download - page 72
Download and view the complete annual report
Please find page 72 of the 2015 Harley Davidson annual report below. You can navigate through the pages in the report by either clicking on the pages listed below, or by using the keyword search tool below to find specific information within the annual report.-
 1
1 -
2
-
3
-
4
-
5
-
6
-
7
-
8
-
9
-
10
-
11
-
12
-
13
-
14
-
15
-
16
-
17
-
18
-
19
-
20
-
21
-
22
-
23
-
24
-
25
-
26
-
27
-
28
-
29
-
30
-
31
-
32
-
33
-
34
-
35
-
36
-
37
-
38
-
39
-
40
-
41
-
42
-
43
-
44
-
45
-
46
-
47
-
48
-
49
-
50
-
51
-
52
-
53
-
54
-
55
-
56
-
57
-
58
-
59
-
60
-
61
-
 62
62 -
 63
63 -
 64
64 -
 65
65 -
 66
66 -
 67
67 -
 68
68 -
 69
69 -
 70
70 -
 71
71 -
 72
72 -
 73
73 -
 74
74 -
 75
75 -
 76
76 -
 77
77 -
 78
78 -
 79
79 -
 80
80 -
 81
81 -
 82
82 -
83
-
84
-
85
-
86
-
87
-
88
-
89
-
90
-
91
-
92
-
93
-
94
-
95
-
96
-
97
-
98
-
99
-
100
-
101
-
102
-
103
-
104
-
105
-
106
-
107
-
108
-
109
-
110
-
111
-
112
-
113
-
114
-
115
-
116
-
117
-
118
-
119
 |
 |

72
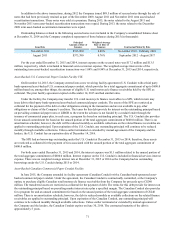
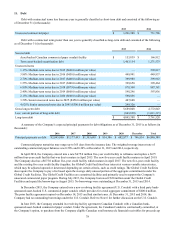
During 2015 and 2014, the Company transferred $100.0 million and $97.1 million, respectively, of Canadian retail
motorcycle finance receivables to the Canadian Conduit for proceeds of $87.5 million and $85.0 million, respectively.
For the years ended December 31, 2015 and 2014, the Company recorded interest expense of $3.0 million and $3.5
million, respectively, on the secured notes. Interest expense on the Canadian Conduit is included in financial services interest
expense. The weighted average interest rate of the outstanding Canadian Conduit was 1.80% and 2.03% at December 31, 2015
and 2014.
As the Company participates in and does not consolidate the Canadian bank-sponsored, multi-seller conduit VIE, the
maximum exposure to loss associated with this VIE, which would only be incurred in the unlikely event that all the finance
receivables and underlying collateral have no residual value, is $24.7 million at December 31, 2015. The maximum exposure is
not an indication of the Company's expected loss exposure.
7. Fair Value Measurements
Certain assets and liabilities are recorded at fair value in the financial statements; some of these are measured on a
recurring basis while others are measured on a non-recurring basis. Assets and liabilities measured on a recurring basis are
those that are adjusted to fair value each time a financial statement is prepared. Assets and liabilities measured on a non-
recurring basis are those that are adjusted to fair value when required by particular events or circumstances. In determining the
fair value of assets and liabilities, the Company uses various valuation techniques. The availability of inputs observable in the
market varies from instrument to instrument and depends on a variety of factors including the type of instrument, whether the
instrument is actively traded, and other characteristics particular to the transaction. For many financial instruments, pricing
inputs are readily observable in the market, the valuation methodology used is widely accepted by market participants, and the
valuation does not require significant management discretion. For other financial instruments, pricing inputs are less observable
in the market and may require management judgment.
The Company assesses the inputs used to measure fair value using a three-tier hierarchy. The hierarchy indicates the
extent to which inputs used in measuring fair value are observable in the market. Level 1 inputs include quoted prices for
identical instruments and are the most observable.
Level 2 inputs include quoted prices for similar assets and observable inputs such as interest rates, foreign currency
exchange rates, commodity prices. The Company uses the market approach to derive the fair value for its level 2 fair value
measurements. Forward contracts for foreign currency, commodities and interest rates are valued using current quoted forward
rates and prices; and investments in marketable securities and cash equivalents are valued using publicly quoted prices.
Level 3 inputs are not observable in the market and include management's judgments about the assumptions market
participants would use in pricing the asset or liability.
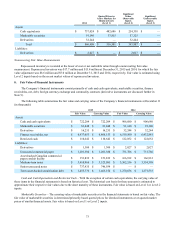
Recurring Fair Value Measurements
The following tables present information about the Company’s assets and liabilities measured at fair value on a recurring
basis as of December 31 (in thousands):
2015
Quoted Prices in
Active Markets for
Identical Assets
(Level 1)
Significant
Other
Observable
Inputs
(Level 2)
Significant
Unobservable
Inputs
(Level 3)
Assets:
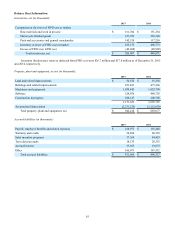
Cash equivalents $ 555,910 $ 390,706 $ 165,204 $ —
Marketable securities 81,448 36,256 45,192 —
Derivatives 16,235 — 16,235 —
Total $ 653,593 $ 426,962 $ 226,631 $ —
Liabilities:
Derivatives $ 1,300 $ — $ 1,300 $ —