Harley Davidson 2015 Annual Report Download - page 34
Download and view the complete annual report
Please find page 34 of the 2015 Harley Davidson annual report below. You can navigate through the pages in the report by either clicking on the pages listed below, or by using the keyword search tool below to find specific information within the annual report.-
 1
1 -
2
-
3
-
4
-
5
-
6
-
7
-
8
-
9
-
10
-
11
-
12
-
13
-
14
-
15
-
16
-
17
-
18
-
19
-
20
-
21
-
22
-
23
-
 24
24 -
 25
25 -
 26
26 -
 27
27 -
 28
28 -
 29
29 -
 30
30 -
 31
31 -
 32
32 -
 33
33 -
 34
34 -
 35
35 -
 36
36 -
 37
37 -
 38
38 -
 39
39 -
 40
40 -
 41
41 -
 42
42 -
 43
43 -
 44
44 -
45
-
46
-
47
-
48
-
49
-
50
-
51
-
52
-
53
-
54
-
55
-
56
-
57
-
58
-
59
-
60
-
61
-
62
-
63
-
64
-
65
-
66
-
67
-
68
-
69
-
70
-
71
-
72
-
73
-
74
-
75
-
76
-
77
-
78
-
79
-
80
-
81
-
82
-
83
-
84
-
85
-
86
-
87
-
88
-
89
-
90
-
91
-
92
-
93
-
94
-
95
-
96
-
97
-
98
-
99
-
100
-
101
-
102
-
103
-
104
-
105
-
106
-
107
-
108
-
109
-
110
-
111
-
112
-
113
-
114
-
115
-
116
-
117
-
118
-
119
 |
 |

34
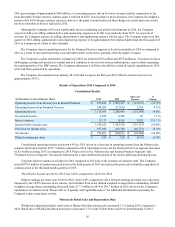
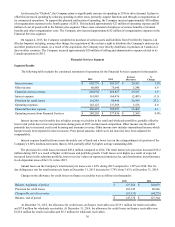
Segment Results
The following table includes the condensed statement of operations for the Motorcycles & Related Products segment (in
thousands):
2014 2013 Increase
(Decrease) %
Change
Revenue:
Motorcycles $ 4,385,863 $ 4,067,510 $ 318,353 7.8%
Parts & Accessories 875,019 873,075 1,944 0.2
General Merchandise 284,826 295,854 (11,028)(3.7)
Other 21,973 21,851 122 0.6
Total revenue 5,567,681 5,258,290 309,391 5.9
Cost of goods sold 3,542,601 3,395,918 146,683 4.3
Gross profit 2,025,080 1,862,372 162,708 8.7
Selling & administrative expense 887,333 847,927 39,406 4.6
Engineering expense 134,600 145,967 (11,367)(7.8)
Restructuring benefit — (2,131) 2,131 (100.0)
Operating expense 1,021,933 991,763 30,170 3.0
Operating income from Motorcycles $ 1,003,147 $ 870,609 $ 132,538 15.2%
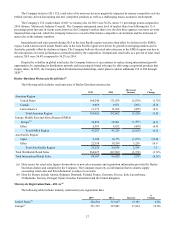
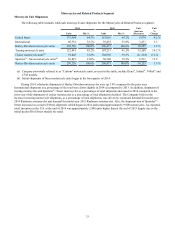
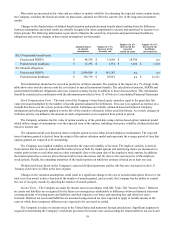
The following table includes the estimated impact of the significant factors affecting the comparability of net revenue,
cost of goods sold and gross profit from 2013 to 2014 (in millions):
Net
Revenue
Cost of
Goods
Sold Gross
Profit
2013 $ 5,259 $ 3,397 $ 1,862
Volume 124 85 39
Price 166 119 47
Foreign currency exchange rates and hedging (31)(19)(12)
Shipment mix 50 (16) 66
Raw material prices — 1 (1)
Manufacturing costs — (24) 24
Total 309 146 163
2014 $ 5,568 $ 3,543 $ 2,025
The following factors affected the comparability of net revenue, cost of goods sold and gross profit from 2013 to 2014:
• Volume increases were driven by the increase in wholesale motorcycle shipments and parts and accessories sales,
partially offset by lower sales volumes for general merchandise. General merchandise revenue was adversely impacted
in 2014 by a SKU reduction plan across the apparel offering focused on transforming the retail customer experience
with a more targeted assortment of popular styles.
• On average, wholesale prices on the Company’s 2014 and 2015 model-year motorcycles are higher than the preceding
model-year resulting in the favorable impact on revenue during the period. The revenue favorability resulting from
model-year price increases was partially offset by an increase in cost related to the significant additional content added
to the 2014 and 2015 model-year motorcycles.
• Net revenue and gross profit were negatively impacted by a devaluation in the Company's key foreign currencies
compared to the U.S. dollar, primarily the Euro, Japanese yen, Brazilian real and Australian dollar, which together
declined approximately 3% on a weighted-average basis in 2014 compared to 2013.
• Shipment mix changes between motorcycle families positively impacted net revenue and gross profit as a result of a
higher mix of Touring motorcycles which was partially offset by an increase in Street motorcycle shipments. Shipment
mix also benefited from favorable model mix within motorcycle families, as well as, favorable mix within the parts
and accessories and general merchandise product lines.
• Raw material prices were slightly higher in 2014 relative to 2013.