Hamilton Beach 2011 Annual Report Download - page 21
Download and view the complete annual report
Please find page 21 of the 2011 Hamilton Beach annual report below. You can navigate through the pages in the report by either clicking on the pages listed below, or by using the keyword search tool below to find specific information within the annual report.-
 1
1 -
2
-
3
-
4
-
5
-
6
-
7
-
8
-
9
-
10
-
 11
11 -
 12
12 -
 13
13 -
 14
14 -
 15
15 -
 16
16 -
 17
17 -
 18
18 -
 19
19 -
 20
20 -
 21
21 -
 22
22 -
 23
23 -
 24
24 -
 25
25
 |
 |

eighteen
Calculation of Return on Capital Employed:
2011
2011 Average Equity (12/31/2010 and each of 2011’s quarter ends). . . . .
2011 Average Debt (12/31/2010 and at each of 2011’s quarter ends) . . . .
2011 Average Cash (12/31/2010 and at each of 2011’s quarter ends) . . . .
2011 Average capital employed, net of cash . . . . . . . . . . . . . . . . . . . . . . . . . . .
2011 Net income, as reported. . . . . . . . . . . . . . . . . . . . . . . . . . . . . . . . . . . . . . .
Less: Applica settlement, after taxes of $21.0 million . . . . . . . . . . . . . . . . . . .
Plus: Applica litigation costs, after taxes of $1.0 million . . . . . . . . . . . . . . . . .
Plus: 2011 Interest expense, as reported . . . . . . . . . . . . . . . . . . . . . . . . . . . . . .
Less: Income taxes on 2011 interest expense at 38%*. . . . . . . . . . . . . . . . . .
Return on capital employed. . . . . . . . . . . . . . . . . . . . . . . . . . . . . . . . . . . . . . . . .
Return on capital employed percentage . . . . . . . . . . . . . . . . . . . . . . . . . . . . . . .
2010
2010 Average Equity (12/31/2009 and each of 2010’s quarter ends) . . . . .
2010 Average Debt (12/31/2009 and at each of 2010’s quarter ends) . . . .
2010 Average Cash (12/31/2009 and at each of 2010’s quarter ends) . . . .
2010 Average capital employed, net of cash . . . . . . . . . . . . . . . . . . . . . . . . . . .
2010 Net income, as reported . . . . . . . . . . . . . . . . . . . . . . . . . . . . . . . . . . . . . . .
Plus: Applica litigation costs, after taxes of $6.6 million . . . . . . . . . . . . . . . . .
Plus: 2010 Interest expense, as reported . . . . . . . . . . . . . . . . . . . . . . . . . . . . . .
Less: Income taxes on 2010 interest expense at 38%**. . . . . . . . . . . . . . . . .
Return on capital employed. . . . . . . . . . . . . . . . . . . . . . . . . . . . . . . . . . . . . . . . .
Return on capital employed percentage . . . . . . . . . . . . . . . . . . . . . . . . . . . . . . .
** Tax rate of 38% represents the Company’s target marginal tax rate compared with 2011’s effective income tax rate of 24.2%.
** Tax rate of 38% represents the Company’s target marginal tax rate compared with 2010’s effective income tax rate of 18.0%.
NMHG
$ 272.5)
229.1)
(152.2)
$ 349.4)
$ 82.6)
–)
–)
15.8)
(6.0)
$ 92.4)
26.4%)
NMHG
$ 210.5)
239.9)
(164.3)
$ 286.1)
$ 32.4)
–)
)16.6)
(6.3)
$ 42.7)
14.9%)
HBB
$ 22.3)
90.6)
(34.8)
$ 78.1)
$ 18.4)
–)
–)
5.2)
(2.0)
$ 21.6)
27.7%)
)
HBB
$ (1.8)
115.7)
(45.5)
$ 68.4)
$ 24.4)
–)
7.2)
(2.7)
$ 28.9)
42.3%)
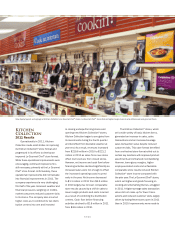
Kitchen
Collection
$ 43.2)
7.6)
(5.1))
$ 45.7)
$ 1.1)
–)
–)
0.5)
(0.2)
$ 1.4)
3.1%)
Kitchen
Collection
$ 43.5)
3.3)
(4.6)
$ 42.2)
$ 3.5)
–)
0.3)
(0.1)
$ 3.7)
8.8%)
NACoal
$ 133.8)
51.9)
(2.7)
$ 183.0)
$ 29.4)
–)
–)
3.0)
(1.1)
$ 31.3)
17.1%)
NACoal
$ 137.9)
42.7)
(4.6)
$ 176.0)
$ 39.6)
–)
3.3)
(1.3)
$ 41.6)
23.6%)
NACCO
Consolidated
$ 526.2)
379.1)
(273.9)
$ 631.4)
$ 162.1)
(39.0)
1.8)
24.5)
(9.3)
$ 140.1)
22.2%)
NACCO
Consolidated
)$ 406.1)
404.6)
(247.5)
$ 563.2)
$ 79.5)
12.2)
27.4)
(10.4)
$ 108.7)
19.3%)
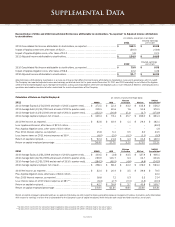
Supplemental Data
(In millions, except percentage data)
2011 Consolidated Net Income attributable to stockholders, as reported . . . . . . . . . . . . . . . . . . . . . . . . . .
Impact of Applica settlement, after taxes of $21.0 . . . . . . . . . . . . . . . . . . . . . . . . . . . . . . . . . . . . . . . . . . . . .
Impact of Applica litigation costs, after taxes of $1.0 . . . . . . . . . . . . . . . . . . . . . . . . . . . . . . . . . . . . . . . . . . .
2011 Adjusted Income attributable to stockholders . . . . . . . . . . . . . . . . . . . . . . . . . . . . . . . . . . . . . . . . . . . .
2010 Consolidated Net Income attributable to stockholders, as reported . . . . . . . . . . . . . . . . . . . . . . . . . .
Impact of Applica litigation costs, after taxes of $6.6 . . . . . . . . . . . . . . . . . . . . . . . . . . . . . . . . . . . . . . . . . . .
2010 Adjusted Income attributable to stockholders . . . . . . . . . . . . . . . . . . . . . . . . . . . . . . . . . . . . . . . . . . . .
Return on capital employed is provided solely as a supplemental disclosure with respect to income generation because management believes it provides useful information
with respect to earnings in a form that is comparable to the Company’s cost of capital employed, which includes both equity and debt securities, net of cash.
Adjusted Income attributable to stockholders is a measure of income that differs from Net Income attributable to stockholders measured in accordance with U.S. GAAP.
The Company has reported adjusted income and earnings per diluted share for the years ended December 31, 2011 and 2010 excluding the net effect of the Applica
settlement and related litigation costs. Management believes a discussion excluding the settlement and litigation costs is more reflective of NACCO’s underlying business
operations and enables investors to better understand the results of operations of the Company.
Reconciliation of 2011 and 2010 Consolidated Net Income attributable to stockholders “As reported” to Adjusted Income attributable
to stockholders:
2011
$ 162.1)
(39.0)
1.8)
$ 124.9)
2010
$ 79.5)
12.2)
$ 91.7)
Diluted earnings
per share
$ 19.28)
(4.64)
0.21)
$ 14.85)
)Diluted earnings
per share
$ 9.53)
1.46)
$ 10.99)
(In millions, except per share data)