Halliburton 2015 Annual Report Download - page 8
Download and view the complete annual report
Please find page 8 of the 2015 Halliburton annual report below. You can navigate through the pages in the report by either clicking on the pages listed below, or by using the keyword search tool below to find specific information within the annual report.-
 1
1 -
 2
2 -
 3
3 -
 4
4 -
 5
5 -
 6
6 -
 7
7 -
 8
8 -
 9
9 -
 10
10 -
 11
11 -
 12
12 -
 13
13 -
 14
14 -
 15
15 -
 16
16 -
 17
17 -
 18
18 -
 19
19 -
20
-
21
-
22
-
23
-
24
-
25
-
26
-
27
-
28
-
29
-
30
-
31
-
32
-
33
-
34
-
35
-
36
-
37
-
38
-
39
-
40
-
41
-
42
-
43
-
44
-
45
-
46
-
47
-
48
-
49
-
50
-
51
-
52
-
53
-
54
-
55
-
56
-
57
-
58
-
59
-
60
-
61
-
62
-
63
-
64
-
65
-
66
-
67
-
68
-
69
-
70
-
71
-
72
-
73
-
74
-
75
-
76
-
77
-
78
-
79
-
80
-
81
-
82
-
83
-
84
-
85
-
86
-
87
-
88
-
89
-
90
-
91
-
92
-
93
-
94
-
95
-
96
-
97
-
98
-
99
-
100
-
101
-
102
-
103
-
104
-
105
-
106
-
107
-
108
 |
 |
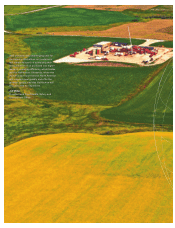
Halliburton’s superior service quality and more efficient technology help our customers
unlock the value of their reserves by bending their cost curve, getting more from their
investment per barrel of oil equivalent. Reducing the cost per barrel requires focus on both
elements of the equation by reducing the numerator – improving efficiency and driving
lower operating costs – and increasing the denominator by improving well productivity
and estimated ultimate recovery.
Halliburton is a leader in the industry’s efforts to drive down costs at every step of drilling
and completion – optimizing bit designs, fluid compositions and well designs, in many cases
reducing drilling time by as much as 50 percent.
Well completion sizes continue to increase. For instance, the average sand volume per well
has doubled in just the last two years. We help our customers avoid disruption and reduce
costs through our world-class supply chain organization that manages Halliburton railcars, basin
inventory levels and well site sand deliveries in real time. We have reduced the time spent
waiting for sand by 70 percent. The cost to deliver a ton of proppant is the lowest it has been
in five years.
Bigger, more complex well completions put more strain on pumping equipment. Halliburton’s
Q10™ technology – the centerpiece of the Frac of the Future™ – enables us to do the same
quantity of work with 20 percent less capital on location and up to 45 percent less maintenance
cost. At year end, Frac of the Future™ spreads represented 60 percent of our fleet.
Surface efficiency helps operators drive down their costs. But customers are also focused
on better wells – identifying the best targets and using the right chemistry to produce more
barrels. Our belief is that for shale development – even within a single well – the rocks are
not the same. For Halliburton, that requires a focus on two high-level categories – sub-surface
insight to help identify the target zones and custom chemistry to help maximize the stimulated
rock volume.
Our DecisionSpace® Unconventionals software suite is designed to help improve well and
reservoir modeling and better predict technical and economic performance. Its dynamically-
updateable model supports E&P business processes to help reduce time for decision-making
and increase team collaboration.
MicroScoutSM Service, a recent addition to our custom chemistry portfolio, is a hydraulic
fracturing treatment designed to deliver proppant into far field microfractures, enhancing the
productive life of new wells. Early trials have indicated more than a 20 percent uplift in production
compared to offset wells.
Through the downturn, we have seen operators adopt these new solutions more quickly. After
years of efficiency improvements, it is our view that subsurface insight and custom chemistry
will drive the next leg in efficiency, helping our customers to further lower their cost per BOE
during the downturn as well as in the next upcycle. We believe Halliburton’s advantages in
North America – the largest oilfield service market in the world – will offer the greatest upside
in the recovery and propel Halliburton in the next phase of the cycle.
North America
Halliburton 2015 Annual Report
www.halliburton.com
6
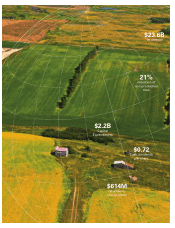
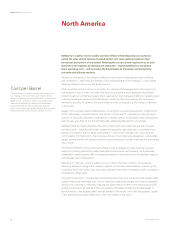
Cost per Barrel
Cost per barrel is a simple concept that underscores
our strategy in the unconventional fields of North
America. Reducing the cost per barrel of oil equivalent
(BOE) for our customers requires focusing on both
sides of the equation by reducing the numerator –
improving efficiency and driving lower operator
costs – and increasing the denominator by improving
well productivity and estimated ultimate recovery.