Halliburton 2015 Annual Report Download - page 10
Download and view the complete annual report
Please find page 10 of the 2015 Halliburton annual report below. You can navigate through the pages in the report by either clicking on the pages listed below, or by using the keyword search tool below to find specific information within the annual report.-
 1
1 -
 2
2 -
 3
3 -
 4
4 -
 5
5 -
 6
6 -
 7
7 -
 8
8 -
 9
9 -
 10
10 -
 11
11 -
 12
12 -
 13
13 -
 14
14 -
 15
15 -
 16
16 -
 17
17 -
 18
18 -
 19
19 -
 20
20 -
 21
21 -
22
-
23
-
24
-
25
-
26
-
27
-
28
-
29
-
30
-
31
-
32
-
33
-
34
-
35
-
36
-
37
-
38
-
39
-
40
-
41
-
42
-
43
-
44
-
45
-
46
-
47
-
48
-
49
-
50
-
51
-
52
-
53
-
54
-
55
-
56
-
57
-
58
-
59
-
60
-
61
-
62
-
63
-
64
-
65
-
66
-
67
-
68
-
69
-
70
-
71
-
72
-
73
-
74
-
75
-
76
-
77
-
78
-
79
-
80
-
81
-
82
-
83
-
84
-
85
-
86
-
87
-
88
-
89
-
90
-
91
-
92
-
93
-
94
-
95
-
96
-
97
-
98
-
99
-
100
-
101
-
102
-
103
-
104
-
105
-
106
-
107
-
108
 |
 |
Halliburton’s international operations proved resilient in 2015, outperforming our peer group,
though we were not immune to the lower commodity price environment. We worked closely
with our customers to improve their project economics through technology and operating
efficiency, and responded quickly to market conditions to right-size our business. With our
continued focus on cost management, we were able to improve operating margins during
the year.
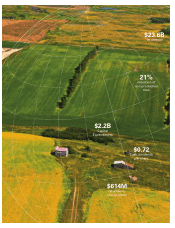
The bifurcation between land and offshore activity continued during 2015. Land-based
projects continued to move forward in many areas, notably in the Middle East, while most
offshore markets, including the North Sea, Angola and Australia, experienced project delays
and cancellations. In 2015, onshore projects represented nearly 60 percent of Halliburton’s
international revenue stream.
Onshore, Halliburton’s focus on mature fields is an important factor in the resilience of our
business; projects in Latin America, the Middle East, and Asia continue even in a low oil
price environment. We estimate that about 70 percent of production today is in mature fields;
this affects large companies, and also underpins the health of many international economies.
In this market, we strive to help our customers increase recovery rates and find bypassed
pay, frequently applying newer technology to older fields. This strategy was successful in
2015, leading to year-over-year revenue growth in several Middle East countries, despite the
challenging macro environment.
Offshore, the international rig count declined more than 13 percent year-over-year. We
believe deep water will be the most challenged market segment in the current commodity
price environment, with average exploration costs estimated to be more than $60 per barrel
of oil equivalent.
To help our customers improve their well economics, Halliburton focuses on reducing
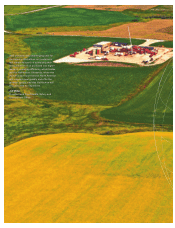
uncertainty and increasing reliability. In a Latin America project, Landmark’s DecisionSpace®
software allowed our clients to reduce drilling days by integrating geological data with well
construction and rendering an interactive asset model. This insight helped eliminate one entire
directional build phase and reduced drilling time by 15 days, thereby reducing the structural
costs of the project while also delivering more productive wells.
With operations in approximately 80 countries around the globe, we believe Halliburton’s
services, technology and execution provide a strong platform for growth in a recovery, and
by focusing on our long-term mature fields and deep water strategies, we can continue to
outperform our competitors.
International
Halliburton 2015 Annual Report
www.halliburton.com
8
Superior Execution
In 2015, Halliburton continued to lead the
industry in quality management. During the
year, 37 Halliburton facilities received the
American Petroleum Institute Specification
Q2 Certification (API Q2), an advanced industry
certification standard for oil and natural gas
service companies. Our Brazil operations
were the first in Latin America to receive
the certification; other facilities included
Indonesia, Malaysia, Brunei, Kuwait, and
Mexico. API Q2 is a risk-based quality
management system approach that focuses
on competency, service design, contingency
planning, supply chain controls, preventive
maintenance, inspection, service quality
plans and management of change.