Halliburton 2015 Annual Report Download - page 4
Download and view the complete annual report
Please find page 4 of the 2015 Halliburton annual report below. You can navigate through the pages in the report by either clicking on the pages listed below, or by using the keyword search tool below to find specific information within the annual report.-
 1
1 -
 2
2 -
 3
3 -
 4
4 -
 5
5 -
 6
6 -
 7
7 -
 8
8 -
 9
9 -
 10
10 -
 11
11 -
 12
12 -
 13
13 -
 14
14 -
 15
15 -
16
-
17
-
18
-
19
-
20
-
21
-
22
-
23
-
24
-
25
-
26
-
27
-
28
-
29
-
30
-
31
-
32
-
33
-
34
-
35
-
36
-
37
-
38
-
39
-
40
-
41
-
42
-
43
-
44
-
45
-
46
-
47
-
48
-
49
-
50
-
51
-
52
-
53
-
54
-
55
-
56
-
57
-
58
-
59
-
60
-
61
-
62
-
63
-
64
-
65
-
66
-
67
-
68
-
69
-
70
-
71
-
72
-
73
-
74
-
75
-
76
-
77
-
78
-
79
-
80
-
81
-
82
-
83
-
84
-
85
-
86
-
87
-
88
-
89
-
90
-
91
-
92
-
93
-
94
-
95
-
96
-
97
-
98
-
99
-
100
-
101
-
102
-
103
-
104
-
105
-
106
-
107
-
108
 |
 |

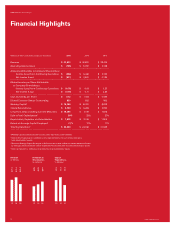
Financial Highlights
Halliburton 2015 Annual Report
www.halliburton.com
2
(Millions of dollars and shares, except per share data) 2015 2014 2013
Revenue $ 23,633 $ 32,870 $ 29,402
Operating Income (Loss) $ (165) $ 5,097 $ 3,138
Amounts Attributable to Company Shareholders:
Income (Loss) from Continuing Operations $ (666) $ 3,436 $ 2,106
Net Income (Loss) $ (671) $ 3,500 $ 2,125
Diluted Income per Share Attributable
to Company Shareholders:
Income (Loss) from Continuing Operations $ (0.78) $ 4.03 $ 2.33
Net Income (Loss) $ (0.79) $ 4.11 $ 2.36
Cash Dividends per Share $ 0.72 $ 0.63 $ 0.525
Diluted Common Shares Outstanding 853 852 902
Working Capital1 $ 16,250 $ 8,781 $ 8,678
Capital Expenditures $ 2,184 $ 3,283 $ 2,934
Long-Term Debt, including Currrent Maturities $ 15,346 $ 7,779 $ 7,816
Debt to Total Capitalization2 50% 33% 37%
Depreciation, Depletion and Amortization $ 1,835 $ 2,126 $ 1,900
Return on Average Capital Employed3 (1)% 17% 11%
Total Capitalization4 $ 30,850 $ 24,196 $ 21,569
1 Working Capital is defined as total current assets less total current liabilities.
2 Debt to Total Capitalization is defined as total debt divided by the sum of total debt plus
total shareholders’ equity.
3 Return on Average Capital Employed is defined as net income before net interest expense divided
by average capital employed. Capital employed includes total debt and total shareholders’ equity.
4 Total Capitalization is defined as total debt plus total shareholders’ equity.
Revenue
in billions
$29.4
13 15
$32.9
$23.6
14
Dividends to
Shareholders
in millions
$465
13 15
$533
$614
14
Capital
Expenditures
in billions
$2.9
13 15
$3.3
$2.2
14