HR Block 2008 Annual Report Download - page 8
Download and view the complete annual report
Please find page 8 of the 2008 HR Block annual report below. You can navigate through the pages in the report by either clicking on the pages listed below, or by using the keyword search tool below to find specific information within the annual report.-
 1
1 -
 2
2 -
 3
3 -
 4
4 -
 5
5 -
 6
6 -
 7
7 -
 8
8 -
 9
9 -
 10
10 -
 11
11 -
 12
12 -
 13
13 -
 14
14 -
 15
15 -
 16
16 -
 17
17 -
 18
18 -
 19
19 -
20
-
21
-
22
-
23
-
24
-
25
-
26
-
27
-
28
-
29
-
30
-
31
-
32
-
33
-
34
-
35
-
36
-
37
-
38
-
39
-
40
-
41
-
42
-
43
-
44
-
45
-
46
-
47
-
48
-
49
-
50
-
51
-
52
-
53
-
54
-
55
-
56
-
57
-
58
-
59
-
60
-
61
-
62
-
63
-
64
-
65
-
66
-
67
-
68
-
69
-
70
-
71
-
72
-
73
-
74
-
75
-
76
-
77
-
78
-
79
-
80
-
81
-
82
-
83
-
84
-
85
-
86
-
87
-
88
-
89
-
90
-
91
-
92
-
93
-
94
-
95
-
96
-
97
-
98
-
99
-
100
-
101
-
102
-
103
-
104
-
105
-
106
-
107
-
108
-
109
-
110
-
111
-
112
 |
 |

6
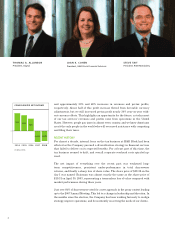
THOMAS A. ALLANSON
President, Digital
JOAN K. COHEN
President, H&R Block Financial Advisors
STEVE TAIT
President, RSM McGladrey
and approximately 30% and 60% increases in revenues and pretax profi ts,
respectively. About half of this profi t increase fl owed from favorable currency
adjustments, but we still increased pretax profi t nearly 30% year-on-year with-
out currency effects. This highlights an opportunity for the future, as today most
of our tax services’ revenues and profi ts come from operations in the United
States. However, people pay taxes in almost every country, and we know Americans
aren’t the only people in the world who will ever need assistance with computing
and fi ling their taxes.
RECENT HISTORY
For almost a decade, internal focus on the tax business at H&R Block had been
affected as the Company pursued a diversifi cation strategy in fi nancial services
that failed to deliver on its expected benefi ts. For at least part of this time, the
tax business seemed to drift, and overall corporate overhead costs spiraled up-
ward.
The net impact of everything over the recent past was weakened long-
term competitiveness, persistent under-performance in total shareowner
returns, and fi nally a sharp loss of share value. The share price of $19.32 on the
day I was named Chairman was almost exactly the same as the share price of
$19.31 on April 30, 2003, representing a tremendous loss of value compared with
market performance during those years.
Just over 84% of shareowners voted for a new approach in the proxy contest leading
up to the 2007 Annual Meeting. This led to a change in leadership and direction. In
the months since the election, the Company has been working furiously to realign
strategy, improve operations, and focus intently on serving the needs of our clients.
CONSOLIDATED NET INCOME
2004 2005 2006 2007 2008
$694 $624 $490
$(434) $(309)
0
IN MILLIONS