Fujitsu 2006 Annual Report Download - page 13
Download and view the complete annual report
Please find page 13 of the 2006 Fujitsu annual report below. You can navigate through the pages in the report by either clicking on the pages listed below, or by using the keyword search tool below to find specific information within the annual report.-
 1
1 -
2
-
 3
3 -
 4
4 -
 5
5 -
 6
6 -
 7
7 -
 8
8 -
 9
9 -
 10
10 -
 11
11 -
 12
12 -
 13
13 -
 14
14 -
 15
15 -
 16
16 -
 17
17 -
 18
18 -
 19
19 -
 20
20 -
 21
21 -
 22
22 -
 23
23 -
24
-
25
-
26
-
27
-
28
-
29
-
30
-
31
-
32
-
33
-
34
-
35
-
36
-
37
-
38
-
39
-
40
-
41
-
42
-
43
-
44
-
45
-
46
-
47
-
48
-
49
-
50
-
51
-
52
-
53
-
54
-
55
-
56
-
57
-
58
-
59
-
60
-
61
-
62
-
63
-
64
-
65
-
66
-
67
-
68
-
69
-
70
-
71
-
72
-
73
-
74
-
75
-
76
-
77
-
78
-
79
-
80
-
81
-
82
-
83
-
84
-
85
-
86
 |
 |

11
Annual Report 2006
The Americas
In North America, the world’s largest IT services
market, leading IT firms have struggled to domi-
nate in the face of market specialization and seg-
mentation. Our strategy will be to shift from a
product-centric approach to operations based on
joint sales activities and the provision of integrated
IT solutions. We will also target growth through
alliances, mergers and acquisitions involving
Fujitsu Consulting, our principal services company
in North America.
Japan
We plan to shift from our existing focus on systems
integration toward greater emphasis on expanding
operations-oriented outsourcing services. In so
doing, we will strive to cultivate even deeper rela-
tionships with customers while also improving the
earnings capabilities of our services. In the small and
medium-size enterprise sector, where we see real
opportunities for growth, we plan to build a stron-
ger presence by offering a broader range of prod-
ucts and services.
2002
2003
2004
2005
2006
Net Sales (Billions of Yen)
Operating Income Margin (%)
3,944
4,161
3,888
4,071
4,024
4.7
1.3
4.1
5.0
4.7
2002
2003
2004
2005
2006
Net Sales (Billions of Yen)
Operating Income Margin (%)
363
446
278
274
298
3.7
–12.9
–6.8
–4.8
1.5
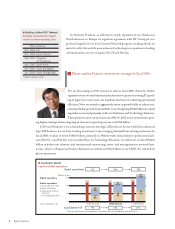
■ Net Sales* and Operating Income
Margin (Japan)
■ Net Sales* and Operating Income
Margin (The Americas)
Business Expansion
Years ended March 31
* Includes intersegment sales
Years ended March 31
* Includes intersegment sales