Fujitsu 2006 Annual Report Download - page 12
Download and view the complete annual report
Please find page 12 of the 2006 Fujitsu annual report below. You can navigate through the pages in the report by either clicking on the pages listed below, or by using the keyword search tool below to find specific information within the annual report.-
 1
1 -
 2
2 -
 3
3 -
 4
4 -
 5
5 -
 6
6 -
 7
7 -
 8
8 -
 9
9 -
 10
10 -
 11
11 -
 12
12 -
 13
13 -
 14
14 -
 15
15 -
 16
16 -
 17
17 -
 18
18 -
 19
19 -
 20
20 -
 21
21 -
 22
22 -
23
-
24
-
25
-
26
-
27
-
28
-
29
-
30
-
31
-
32
-
33
-
34
-
35
-
36
-
37
-
38
-
39
-
40
-
41
-
42
-
43
-
44
-
45
-
46
-
47
-
48
-
49
-
50
-
51
-
52
-
53
-
54
-
55
-
56
-
57
-
58
-
59
-
60
-
61
-
62
-
63
-
64
-
65
-
66
-
67
-
68
-
69
-
70
-
71
-
72
-
73
-
74
-
75
-
76
-
77
-
78
-
79
-
80
-
81
-
82
-
83
-
84
-
85
-
86
 |
 |

10 Fujitsu Limited
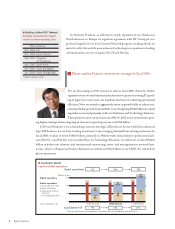
Europe
We will work to accelerate the growth of Fujitsu
Services, mainly focused on outsourcing services,
and Fujitsu Siemens Computers, which primarily
handles a range of servers and PCs. In addition to
maintaining and enhancing its position in the UK
public sector, Fujitsu Services is striving to capture
a larger share of private-sector demand. Fujitsu
Siemens Computers, having acquired the product
support division of Siemens Business Services, a
Siemens AG subsidiary, now has an integrated glo-
bal support framework extending from product sup-
ply to maintenance services.
Asia, Australia and
Other Regions
In Asia and Australia, we will develop solutions
businesses carefully tailored to the characteristics
of individual country markets. In China, we will
provide support to Japanese automakers, consumer
electronics manufacturers and other customers as
they roll out their strategies in the country. This
will give us a foothold in the market to support
future business expansion.
2002
2003
2004
2005
2006
Net Sales (Billions of Yen)
Operating Income Margin (%)
632
605
543
563
596
3.6
–3.0
0.7
1.2
2.0
2002
2003
2004
2005
2006
Net Sales (Billions of Yen)
Operating Income Margin (%)
718
473
464
579
602
1.2
2.7
2.3
2.0
2.1
■ Net Sales* and Operating Income
Margin (Europe)
■ Net Sales* and Operating Income Margin
(Asia, Australia and Other Regions)
Growth through Global
Feature
Section
Rolling out strategies tailored to each region
Years ended March 31
* Includes intersegment sales
Years ended March 31
* Includes intersegment sales