Freddie Mac 2012 Annual Report Download - page 8
Download and view the complete annual report
Please find page 8 of the 2012 Freddie Mac annual report below. You can navigate through the pages in the report by either clicking on the pages listed below, or by using the keyword search tool below to find specific information within the annual report.-
 1
1 -
 2
2 -
 3
3 -
 4
4 -
 5
5 -
 6
6 -
 7
7 -
 8
8 -
 9
9 -
 10
10 -
 11
11 -
 12
12 -
 13
13 -
 14
14 -
 15
15 -
 16
16 -
 17
17 -
 18
18 -
 19
19 -
20
-
21
-
22
-
23
-
24
-
25
-
26
-
27
-
28
-
29
-
30
-
31
-
32
-
33
-
34
-
35
-
36
-
37
-
38
-
39
-
40
-
41
-
42
-
43
-
44
-
45
-
46
-
47
-
48
-
49
-
50
-
51
-
52
-
53
-
54
-
55
-
56
-
57
-
58
-
59
-
60
-
61
-
62
-
63
-
64
-
65
-
66
-
67
-
68
-
69
-
70
-
71
-
72
-
73
-
74
-
75
-
76
-
77
-
78
-
79
-
80
-
81
-
82
-
83
-
84
-
85
-
86
-
87
-
88
-
89
-
90
-
91
-
92
-
93
-
94
-
95
-
96
-
97
-
98
-
99
-
100
-
101
-
102
-
103
-
104
-
105
-
106
-
107
-
108
-
109
-
110
-
111
-
112
-
113
-
114
-
115
-
116
-
117
-
118
-
119
-
120
-
121
-
122
-
123
-
124
-
125
-
126
-
127
-
128
-
129
-
130
-
131
-
132
-
133
-
134
-
135
-
136
-
137
-
138
-
139
-
140
-
141
-
142
-
143
-
144
-
145
-
146
-
147
-
148
-
149
-
150
-
151
-
152
-
153
-
154
-
155
-
156
-
157
-
158
-
159
-
160
-
161
-
162
-
163
-
164
-
165
-
166
-
167
-
168
-
169
-
170
-
171
-
172
-
173
-
174
-
175
-
176
-
177
-
178
-
179
-
180
-
181
-
182
-
183
-
184
-
185
-
186
-
187
-
188
-
189
-
190
-
191
-
192
-
193
-
194
-
195
-
196
-
197
-
198
-
199
-
200
-
201
-
202
-
203
-
204
-
205
-
206
-
207
-
208
-
209
-
210
-
211
-
212
-
213
-
214
-
215
-
216
-
217
-
218
-
219
-
220
-
221
-
222
-
223
-
224
-
225
-
226
-
227
-
228
-
229
-
230
-
231
-
232
-
233
-
234
-
235
-
236
-
237
-
238
-
239
-
240
-
241
-
242
-
243
-
244
-
245
-
246
-
247
-
248
-
249
-
250
-
251
-
252
-
253
-
254
-
255
-
256
-
257
-
258
-
259
-
260
-
261
-
262
-
263
-
264
-
265
-
266
-
267
-
268
-
269
-
270
-
271
-
272
-
273
-
274
-
275
-
276
-
277
-
278
-
279
-
280
-
281
-
282
-
283
-
284
-
285
-
286
-
287
-
288
-
289
-
290
-
291
-
292
-
293
-
294
-
295
-
296
-
297
-
298
-
299
-
300
-
301
-
302
-
303
-
304
-
305
-
306
-
307
-
308
-
309
-
310
-
311
-
312
-
313
-
314
-
315
-
316
-
317
-
318
-
319
-
320
-
321
-
322
-
323
-
324
-
325
-
326
-
327
-
328
-
329
-
330
-
331
-
332
-
333
-
334
-
335
-
336
-
337
-
338
-
339
-
340
-
341
-
342
-
343
-
344
-
345
-
346
-
347
-
348
-
349
-
350
-
351
-
352
-
353
-
354
-
355
-
356
-
357
-
358
-
359
-
360
-
361
-
362
-
363
-
364
-
365
-
366
-
367
-
368
-
369
-
370
-
371
-
372
-
373
-
374
-
375
-
376
-
377
-
378
-
379
-
380
-
381
-
382
-
383
-
384
-
385
-
386
-
387
-
388
-
389
-
390
-
391
-
392
-
393
-
394
-
395
 |
 |

foreclosures. We believe our actions are helping communities across the country by providing America’s families with
access to mortgage funding at low rates while helping distressed borrowers keep their homes and avoid foreclosure, where
feasible.
Summary of Financial Results
During 2012, we observed certain signs of improvement in the housing market, which contributed positively to our
financial results. Our comprehensive income for the year ended December 31, 2012 was $16.0 billion, consisting of
$11.0 billion of net income and $5.1 billion of total other comprehensive income. By comparison, our comprehensive income
(loss) for the year ended December 31, 2011 was $(1.2) billion, consisting of $(5.3) billion of net income (loss) and
$4.0 billion of total other comprehensive income.
Our total equity was $8.8 billion at December 31, 2012, reflecting our total equity balance of $4.9 billion at
September 30, 2012, comprehensive income of $5.7 billion for the fourth quarter of 2012 and our dividend payment of
$1.8 billion on our senior preferred stock in December 2012. As a result of our positive net worth at December 31, 2012, no
draw is being requested from Treasury under the Purchase Agreement for the fourth quarter of 2012.
Our Primary Business Objectives
We are focused on the following primary business objectives: (a) providing credit availability for mortgages and
maintaining foreclosure prevention activities; (b) minimizing our credit losses; (c) developing mortgage market
enhancements in support of a new infrastructure for the secondary mortgage market; (d) maintaining sound credit quality on
the loans we purchase or guarantee; (e) contracting the dominant presence of the GSEs in the marketplace; and
(f) strengthening our infrastructure and improving overall efficiency while also focusing on retention of key employees. Our
business objectives reflect direction we have received from the Conservator, including the Conservatorship Scorecard. See
“EXECUTIVE COMPENSATION — Compensation Discussion and Analysis” for further information.
Providing Credit Availability for Mortgages and Maintaining Foreclosure Prevention Activities
We provide liquidity and support to the U.S. mortgage market in a number of important ways:
• Our support enables borrowers to have access to a variety of conforming mortgage products, including the prepayable
30-year fixed-rate mortgage, which historically has represented the foundation of the mortgage market.
• Our support provides lenders with a constant source of liquidity for conforming mortgage products. We estimate that
we, Fannie Mae, and Ginnie Mae collectively guaranteed more than 90% of the single-family conforming mortgages
originated during 2012 and 2011.
• Our consistent market presence provides assurance to our customers that there will be a buyer for their conforming
loans that meet our credit standards. We believe this liquidity provides our customers with confidence to continue
lending in difficult environments.
• We are an important counter-cyclical influence as we stay in the market even when other sources of capital have
withdrawn.
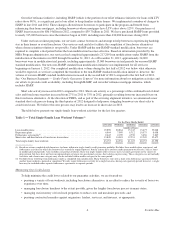
During 2012 and 2011, we purchased or issued other guarantee commitments for $426.8 billion and $320.8 billion in
UPB of single-family conforming mortgage loans, representing approximately 2.0 million and 1.5 million homes,
respectively.
Borrowers typically pay a lower interest rate on loans acquired or guaranteed by Freddie Mac, Fannie Mae, or Ginnie
Mae. Mortgage originators are able to offer homebuyers and homeowners lower mortgage rates on conforming loan
products, in part because of the value investors place on GSE-guaranteed mortgage-related securities. In December 2012, we
estimated that borrowers were paying an average of 43 basis points less on these conforming loans than on non-conforming
loans. These estimates were based on data provided by HSH Associates, a third-party provider of mortgage market data.
We are focused on reducing the number of foreclosures and helping to keep families in their homes. In 2012, we
continued to introduce new initiatives designed to help eligible borrowers keep their homes and avoid foreclosure. Since
2009, we have helped more than 785,000 borrowers experiencing hardship complete a loan workout.
3Freddie Mac