Freddie Mac 2012 Annual Report Download - page 17
Download and view the complete annual report
Please find page 17 of the 2012 Freddie Mac annual report below. You can navigate through the pages in the report by either clicking on the pages listed below, or by using the keyword search tool below to find specific information within the annual report.-
 1
1 -
2
-
3
-
4
-
5
-
6
-
 7
7 -
 8
8 -
 9
9 -
 10
10 -
 11
11 -
 12
12 -
 13
13 -
 14
14 -
 15
15 -
 16
16 -
 17
17 -
 18
18 -
 19
19 -
 20
20 -
 21
21 -
 22
22 -
 23
23 -
 24
24 -
 25
25 -
 26
26 -
 27
27 -
28
-
29
-
30
-
31
-
32
-
33
-
34
-
35
-
36
-
37
-
38
-
39
-
40
-
41
-
42
-
43
-
44
-
45
-
46
-
47
-
48
-
49
-
50
-
51
-
52
-
53
-
54
-
55
-
56
-
57
-
58
-
59
-
60
-
61
-
62
-
63
-
64
-
65
-
66
-
67
-
68
-
69
-
70
-
71
-
72
-
73
-
74
-
75
-
76
-
77
-
78
-
79
-
80
-
81
-
82
-
83
-
84
-
85
-
86
-
87
-
88
-
89
-
90
-
91
-
92
-
93
-
94
-
95
-
96
-
97
-
98
-
99
-
100
-
101
-
102
-
103
-
104
-
105
-
106
-
107
-
108
-
109
-
110
-
111
-
112
-
113
-
114
-
115
-
116
-
117
-
118
-
119
-
120
-
121
-
122
-
123
-
124
-
125
-
126
-
127
-
128
-
129
-
130
-
131
-
132
-
133
-
134
-
135
-
136
-
137
-
138
-
139
-
140
-
141
-
142
-
143
-
144
-
145
-
146
-
147
-
148
-
149
-
150
-
151
-
152
-
153
-
154
-
155
-
156
-
157
-
158
-
159
-
160
-
161
-
162
-
163
-
164
-
165
-
166
-
167
-
168
-
169
-
170
-
171
-
172
-
173
-
174
-
175
-
176
-
177
-
178
-
179
-
180
-
181
-
182
-
183
-
184
-
185
-
186
-
187
-
188
-
189
-
190
-
191
-
192
-
193
-
194
-
195
-
196
-
197
-
198
-
199
-
200
-
201
-
202
-
203
-
204
-
205
-
206
-
207
-
208
-
209
-
210
-
211
-
212
-
213
-
214
-
215
-
216
-
217
-
218
-
219
-
220
-
221
-
222
-
223
-
224
-
225
-
226
-
227
-
228
-
229
-
230
-
231
-
232
-
233
-
234
-
235
-
236
-
237
-
238
-
239
-
240
-
241
-
242
-
243
-
244
-
245
-
246
-
247
-
248
-
249
-
250
-
251
-
252
-
253
-
254
-
255
-
256
-
257
-
258
-
259
-
260
-
261
-
262
-
263
-
264
-
265
-
266
-
267
-
268
-
269
-
270
-
271
-
272
-
273
-
274
-
275
-
276
-
277
-
278
-
279
-
280
-
281
-
282
-
283
-
284
-
285
-
286
-
287
-
288
-
289
-
290
-
291
-
292
-
293
-
294
-
295
-
296
-
297
-
298
-
299
-
300
-
301
-
302
-
303
-
304
-
305
-
306
-
307
-
308
-
309
-
310
-
311
-
312
-
313
-
314
-
315
-
316
-
317
-
318
-
319
-
320
-
321
-
322
-
323
-
324
-
325
-
326
-
327
-
328
-
329
-
330
-
331
-
332
-
333
-
334
-
335
-
336
-
337
-
338
-
339
-
340
-
341
-
342
-
343
-
344
-
345
-
346
-
347
-
348
-
349
-
350
-
351
-
352
-
353
-
354
-
355
-
356
-
357
-
358
-
359
-
360
-
361
-
362
-
363
-
364
-
365
-
366
-
367
-
368
-
369
-
370
-
371
-
372
-
373
-
374
-
375
-
376
-
377
-
378
-
379
-
380
-
381
-
382
-
383
-
384
-
385
-
386
-
387
-
388
-
389
-
390
-
391
-
392
-
393
-
394
-
395
 |
 |
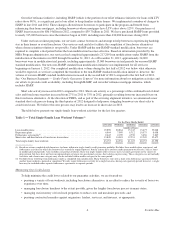
• Non-interest expense declined to $2.2 billion for 2012, from $2.5 billion for 2011, primarily due to a decrease in REO
operations expense during 2012 compared to 2011 as a result of improving home prices in certain geographical areas
with significant REO activity.
• Comprehensive income was $16.0 billion for 2012 compared to comprehensive income (loss) of $(1.2) billion for
2011. Comprehensive income for 2012 consisted of $11.0 billion of net income and $5.1 billion of other
comprehensive income, primarily due to a reduction in net unrealized losses on our available-for-sale securities.
Our Business
We conduct business in the U.S. residential mortgage market and the global securities market, subject to the direction of
our Conservator, FHFA, and under regulatory supervision of FHFA, the SEC, HUD, and Treasury. The size of the U.S.
residential mortgage market is affected by many factors, including changes in interest rates, home ownership rates, home
prices, the supply of housing and lender preferences regarding credit risk and borrower preferences regarding mortgage debt.
The amount of residential mortgage debt available for us to purchase and the mix of available loan products are also affected
by several factors, including the volume of mortgages meeting the requirements of our charter (which is affected by changes
in the conforming loan limit determined by FHFA), our own preference for credit risk reflected in our purchase standards and
the mortgage purchase and securitization activity of other financial institutions. We conduct our business operations solely in
the U.S. and its territories.
In addition to the directives given us by our Conservator, our charter forms the framework for our business activities,
the initiatives we bring to market and the services we provide to the nation’s residential housing and mortgage industries.
Our charter also determines the types of mortgage loans that we are permitted to purchase. Our statutory mission as defined
in our charter is to:
• provide stability in the secondary market for residential mortgages;
• respond appropriately to the private capital market;
• provide ongoing assistance to the secondary market for residential mortgages (including activities relating to
mortgages for low- and moderate-income families, involving a reasonable economic return that may be less than the
return earned on other activities); and
• promote access to mortgage credit throughout the U.S. (including central cities, rural areas, and other underserved
areas).
Our charter does not permit us to originate mortgage loans or lend money directly to consumers in the primary mortgage
market. We provide liquidity, stability and affordability to the U.S. housing market primarily by providing our credit
guarantee for residential mortgages originated by mortgage lenders and investing in mortgage loans and mortgage-related
securities. We use mortgage securitization as an integral part of our activities. Mortgage securitization is a process by which
we purchase mortgage loans that lenders originate, and pool these loans into guaranteed mortgage securities that are sold in
global capital markets, generating proceeds that support future loan origination activity by lenders. The primary Freddie Mac
guaranteed mortgage-related security is the single-class PC. We also aggregate and resecuritize mortgage-related securities
that are issued by us, other GSEs, HFAs, or private (non-agency) entities, and issue other single-class and multiclass
mortgage-related securities to third-party investors. We also enter into certain other guarantee commitments for mortgage
loans, HFA bonds under the HFA initiative, and multifamily housing revenue bonds held by third parties.
Our charter limits our purchases of single-family loans to the conforming loan market. The conforming loan market is
defined by loans originated with UPBs at or below limits determined annually based on changes in FHFA’s housing price
index, a method established and maintained by FHFA for determining the national average single-family home price. Since
2006, the base conforming loan limit for a one-family residence has been set at $417,000, and higher limits have been
established in certain “high-cost” areas (currently, up to $625,500 for a one-family residence). Higher limits also apply to
two- to four-family residences and for mortgages secured by properties in Alaska, Guam, Hawaii, and the U.S. Virgin
Islands.
12 Freddie Mac