Freddie Mac 2012 Annual Report Download - page 15
Download and view the complete annual report
Please find page 15 of the 2012 Freddie Mac annual report below. You can navigate through the pages in the report by either clicking on the pages listed below, or by using the keyword search tool below to find specific information within the annual report.-
 1
1 -
2
-
3
-
4
-
 5
5 -
 6
6 -
 7
7 -
 8
8 -
 9
9 -
 10
10 -
 11
11 -
 12
12 -
 13
13 -
 14
14 -
 15
15 -
 16
16 -
 17
17 -
 18
18 -
 19
19 -
 20
20 -
 21
21 -
 22
22 -
 23
23 -
 24
24 -
 25
25 -
26
-
27
-
28
-
29
-
30
-
31
-
32
-
33
-
34
-
35
-
36
-
37
-
38
-
39
-
40
-
41
-
42
-
43
-
44
-
45
-
46
-
47
-
48
-
49
-
50
-
51
-
52
-
53
-
54
-
55
-
56
-
57
-
58
-
59
-
60
-
61
-
62
-
63
-
64
-
65
-
66
-
67
-
68
-
69
-
70
-
71
-
72
-
73
-
74
-
75
-
76
-
77
-
78
-
79
-
80
-
81
-
82
-
83
-
84
-
85
-
86
-
87
-
88
-
89
-
90
-
91
-
92
-
93
-
94
-
95
-
96
-
97
-
98
-
99
-
100
-
101
-
102
-
103
-
104
-
105
-
106
-
107
-
108
-
109
-
110
-
111
-
112
-
113
-
114
-
115
-
116
-
117
-
118
-
119
-
120
-
121
-
122
-
123
-
124
-
125
-
126
-
127
-
128
-
129
-
130
-
131
-
132
-
133
-
134
-
135
-
136
-
137
-
138
-
139
-
140
-
141
-
142
-
143
-
144
-
145
-
146
-
147
-
148
-
149
-
150
-
151
-
152
-
153
-
154
-
155
-
156
-
157
-
158
-
159
-
160
-
161
-
162
-
163
-
164
-
165
-
166
-
167
-
168
-
169
-
170
-
171
-
172
-
173
-
174
-
175
-
176
-
177
-
178
-
179
-
180
-
181
-
182
-
183
-
184
-
185
-
186
-
187
-
188
-
189
-
190
-
191
-
192
-
193
-
194
-
195
-
196
-
197
-
198
-
199
-
200
-
201
-
202
-
203
-
204
-
205
-
206
-
207
-
208
-
209
-
210
-
211
-
212
-
213
-
214
-
215
-
216
-
217
-
218
-
219
-
220
-
221
-
222
-
223
-
224
-
225
-
226
-
227
-
228
-
229
-
230
-
231
-
232
-
233
-
234
-
235
-
236
-
237
-
238
-
239
-
240
-
241
-
242
-
243
-
244
-
245
-
246
-
247
-
248
-
249
-
250
-
251
-
252
-
253
-
254
-
255
-
256
-
257
-
258
-
259
-
260
-
261
-
262
-
263
-
264
-
265
-
266
-
267
-
268
-
269
-
270
-
271
-
272
-
273
-
274
-
275
-
276
-
277
-
278
-
279
-
280
-
281
-
282
-
283
-
284
-
285
-
286
-
287
-
288
-
289
-
290
-
291
-
292
-
293
-
294
-
295
-
296
-
297
-
298
-
299
-
300
-
301
-
302
-
303
-
304
-
305
-
306
-
307
-
308
-
309
-
310
-
311
-
312
-
313
-
314
-
315
-
316
-
317
-
318
-
319
-
320
-
321
-
322
-
323
-
324
-
325
-
326
-
327
-
328
-
329
-
330
-
331
-
332
-
333
-
334
-
335
-
336
-
337
-
338
-
339
-
340
-
341
-
342
-
343
-
344
-
345
-
346
-
347
-
348
-
349
-
350
-
351
-
352
-
353
-
354
-
355
-
356
-
357
-
358
-
359
-
360
-
361
-
362
-
363
-
364
-
365
-
366
-
367
-
368
-
369
-
370
-
371
-
372
-
373
-
374
-
375
-
376
-
377
-
378
-
379
-
380
-
381
-
382
-
383
-
384
-
385
-
386
-
387
-
388
-
389
-
390
-
391
-
392
-
393
-
394
-
395
 |
 |

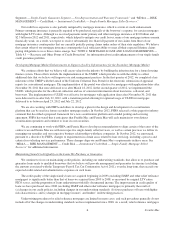
Table 3 — Credit Statistics, Single-Family Credit Guarantee Portfolio
As of
12/31/2012 9/30/2012 6/30/2012 3/31/2012 12/31/2011
Payment status —
One month past due .............................................. 1.85% 2.02% 1.79% 1.63% 2.02%
Two months past due ............................................. 0.66% 0.66% 0.60% 0.57% 0.70%
Seriously delinquent(1) ............................................. 3.25% 3.37% 3.45% 3.51% 3.58%
Non-performing loans (in millions)(2) .................................... $128,599 $131,106 $118,463 $119,599 $120,514
Single-family loan loss reserve (in millions)(3) ............................. $ 30,508 $ 33,298 $ 35,298 $ 37,771 $ 38,916
REO inventory (in properties) ........................................ 49,071 50,913 53,271 59,307 60,535
REO assets, net carrying value (in millions) .............................. $ 4,314 $ 4,459 $ 4,715 $ 5,333 $ 5,548
For the Three Months Ended
12/31/2012 9/30/2012 6/30/2012 3/31/2012 12/31/2011
(in units, unless noted)
Seriously delinquent loan additions(1) .................................... 72,626 76,104 75,904 80,815 95,661
Loan modifications(4) ............................................... 19,898 20,864 15,142 13,677 19,048
REO acquisitions .................................................. 18,672 20,302 20,033 23,805 24,758
REO disposition severity ratio:(5)
California ..................................................... 34.4% 37.7% 41.6% 44.2% 44.6%
Arizona ....................................................... 35.9% 36.3% 40.4% 45.0% 46.7%
Florida ....................................................... 42.6% 44.7% 46.2% 48.6% 50.1%
Nevada ....................................................... 45.6% 50.6% 54.3% 56.5% 54.2%
Illinois ....................................................... 46.5% 47.7% 47.8% 49.3% 51.2%
Total U.S ..................................................... 35.2% 36.2% 37.9% 40.3% 41.2%
Single-family provision (benefit) for credit losses (in millions) ................. $ (658) $ 650 $ 177 $ 1,844 $ 2,664
Single-family credit losses (in millions) ................................. $ 2,396 $ 2,936 $ 2,858 $ 3,435 $ 3,209
(1) See “MD&A — RISK MANAGEMENT — Credit Risk — Mortgage Credit Risk — Single-Family Mortgage Credit Risk — Delinquencies” for further
information about our reported serious delinquency rates.
(2) Consists of the UPB of loans in our single-family credit guarantee portfolio that have undergone a TDR or that are seriously delinquent. During the third
quarter of 2012, we changed the treatment of single-family loans discharged in Chapter 7 bankruptcy to classify these loans as TDRs, regardless of the
borrowers’ payment status. As a result, we newly classified approximately $19.5 billion in UPB of loans discharged in Chapter 7 bankruptcy as TDRs in
the third quarter of 2012. As of December 31, 2012 and 2011, approximately $65.8 billion and $44.4 billion in UPB of TDR loans, respectively, were no
longer seriously delinquent.
(3) Consists of the combination of: (a) our allowance for loan losses on mortgage loans held for investment; and (b) our reserve for guarantee losses
associated with non-consolidated single-family mortgage securitization trusts and other guarantee commitments.
(4) Represents the number of modification agreements with borrowers completed during the quarter. Excludes forbearance agreements, repayment plans,
and loans in modification trial periods.
(5) States presented represent the five states where our credit losses were greatest during 2012. Calculated as the amount of our losses recorded on
disposition of REO properties during the respective quarterly period, excluding those subject to repurchase requests made to our seller/servicers, divided
by the aggregate UPB of the related loans. The amount of losses recognized on disposition of the properties is equal to the amount by which the UPB of
the loans exceeds the amount of sales proceeds from disposition of the properties. Excludes sales commissions and other expenses, such as property
maintenance and costs, as well as applicable recoveries from credit enhancements, such as mortgage insurance.
In discussing our credit performance, we often use the terms “credit losses” and “credit-related expenses.” These terms
are significantly different. Our “credit losses” consist of charge-offs and REO operations expense, while our “credit-related
expenses” consist of our provision for credit losses and REO operations expense.
Since the beginning of 2008, on an aggregate basis, we have recorded provision for credit losses associated with single-
family loans of approximately $75.2 billion, and have recorded an additional $3.9 billion in losses on loans purchased from
PC trusts, net of recoveries. The majority of these losses are associated with loans originated in 2005 through 2008. While
loans originated in 2005 through 2008 will give rise to additional credit losses that have not yet been incurred and, thus, have
not yet been provisioned for, we believe that, as of December 31, 2012, we have reserved for or charged-off the majority of
the total expected credit losses for these loans. Nevertheless, various factors, such as continued high unemployment rates or
future declines in home prices, could require us to provide for losses on these loans beyond our current expectations.
Our loan loss reserves declined in every quarter of 2012, which reflects improvement in both borrower payment
performance and lower severity ratios for both REO dispositions and short sale transactions due to the improvements in
home prices in most areas during 2012. Our REO inventory also declined in every quarter of 2012, which reflects that our
sales of REO properties exceeded the volume of our REO acquisitions due to lower foreclosure activity as well as an increase
in the volume of short sales prior to foreclosure.
Our average REO disposition severity ratio improved to 35.2% for the fourth quarter of 2012 compared to 41.2% for the
fourth quarter of 2011. Although this ratio improved for each quarter of 2012, it remains high as compared to our experience
in periods before 2007.
10 Freddie Mac