Freddie Mac 2012 Annual Report Download - page 13
Download and view the complete annual report
Please find page 13 of the 2012 Freddie Mac annual report below. You can navigate through the pages in the report by either clicking on the pages listed below, or by using the keyword search tool below to find specific information within the annual report.-
 1
1 -
2
-
 3
3 -
 4
4 -
 5
5 -
 6
6 -
 7
7 -
 8
8 -
 9
9 -
 10
10 -
 11
11 -
 12
12 -
 13
13 -
 14
14 -
 15
15 -
 16
16 -
 17
17 -
 18
18 -
 19
19 -
 20
20 -
 21
21 -
 22
22 -
 23
23 -
24
-
25
-
26
-
27
-
28
-
29
-
30
-
31
-
32
-
33
-
34
-
35
-
36
-
37
-
38
-
39
-
40
-
41
-
42
-
43
-
44
-
45
-
46
-
47
-
48
-
49
-
50
-
51
-
52
-
53
-
54
-
55
-
56
-
57
-
58
-
59
-
60
-
61
-
62
-
63
-
64
-
65
-
66
-
67
-
68
-
69
-
70
-
71
-
72
-
73
-
74
-
75
-
76
-
77
-
78
-
79
-
80
-
81
-
82
-
83
-
84
-
85
-
86
-
87
-
88
-
89
-
90
-
91
-
92
-
93
-
94
-
95
-
96
-
97
-
98
-
99
-
100
-
101
-
102
-
103
-
104
-
105
-
106
-
107
-
108
-
109
-
110
-
111
-
112
-
113
-
114
-
115
-
116
-
117
-
118
-
119
-
120
-
121
-
122
-
123
-
124
-
125
-
126
-
127
-
128
-
129
-
130
-
131
-
132
-
133
-
134
-
135
-
136
-
137
-
138
-
139
-
140
-
141
-
142
-
143
-
144
-
145
-
146
-
147
-
148
-
149
-
150
-
151
-
152
-
153
-
154
-
155
-
156
-
157
-
158
-
159
-
160
-
161
-
162
-
163
-
164
-
165
-
166
-
167
-
168
-
169
-
170
-
171
-
172
-
173
-
174
-
175
-
176
-
177
-
178
-
179
-
180
-
181
-
182
-
183
-
184
-
185
-
186
-
187
-
188
-
189
-
190
-
191
-
192
-
193
-
194
-
195
-
196
-
197
-
198
-
199
-
200
-
201
-
202
-
203
-
204
-
205
-
206
-
207
-
208
-
209
-
210
-
211
-
212
-
213
-
214
-
215
-
216
-
217
-
218
-
219
-
220
-
221
-
222
-
223
-
224
-
225
-
226
-
227
-
228
-
229
-
230
-
231
-
232
-
233
-
234
-
235
-
236
-
237
-
238
-
239
-
240
-
241
-
242
-
243
-
244
-
245
-
246
-
247
-
248
-
249
-
250
-
251
-
252
-
253
-
254
-
255
-
256
-
257
-
258
-
259
-
260
-
261
-
262
-
263
-
264
-
265
-
266
-
267
-
268
-
269
-
270
-
271
-
272
-
273
-
274
-
275
-
276
-
277
-
278
-
279
-
280
-
281
-
282
-
283
-
284
-
285
-
286
-
287
-
288
-
289
-
290
-
291
-
292
-
293
-
294
-
295
-
296
-
297
-
298
-
299
-
300
-
301
-
302
-
303
-
304
-
305
-
306
-
307
-
308
-
309
-
310
-
311
-
312
-
313
-
314
-
315
-
316
-
317
-
318
-
319
-
320
-
321
-
322
-
323
-
324
-
325
-
326
-
327
-
328
-
329
-
330
-
331
-
332
-
333
-
334
-
335
-
336
-
337
-
338
-
339
-
340
-
341
-
342
-
343
-
344
-
345
-
346
-
347
-
348
-
349
-
350
-
351
-
352
-
353
-
354
-
355
-
356
-
357
-
358
-
359
-
360
-
361
-
362
-
363
-
364
-
365
-
366
-
367
-
368
-
369
-
370
-
371
-
372
-
373
-
374
-
375
-
376
-
377
-
378
-
379
-
380
-
381
-
382
-
383
-
384
-
385
-
386
-
387
-
388
-
389
-
390
-
391
-
392
-
393
-
394
-
395
 |
 |

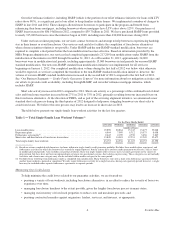
Table 2 — Single-Family Credit Guarantee Portfolio Summary(1)
At December 31, 2012
Year Ended
December 31, 2012
Percent of
Portfolio
Average
Credit
Score(2)
Current
LTV Ratio(3)
Current
LTV Ratio
>100%(3)(4)
Serious
Delinquency
Rate(5)
Percent of
Credit Losses(6)
Loans originated — 2009 to 2012:
Relief refinance loans:
HARP loans ................................... 11% 735 100% 43% 1.06% 2.1%
Other relief refinance loans ........................ 7 749 58 — 0.29 0.1
All other loans ................................... 45 757 66 1 0.27 1.5
Subtotal — 2009 to 2012 originations .................. 63 753 71 7 0.39 3.7
Loans originated — 2005 to 2008 ....................... 24 708 98 42 9.56 87.2
Loans originated — 2004 and prior ...................... 13 715 56 6 3.20 9.1
Total ............................................ 100% 737 75 15 3.25 100.0%
At December 31, 2011
Year Ended
December 31, 2011
Percent of
Portfolio
Average
Credit
Score(2)
Current
LTV Ratio(3)
Current
LTV Ratio
>100%(3)(4)
Serious
Delinquency
Rate(5)
Percent of
Credit Losses(6)
Loans originated — 2009 to 2011:
Relief refinance loans:
HARP loans ................................... 6% 737 97% 35% 1.08% 1.0%
Other relief refinance loans ........................ 5 751 61 — 0.17 0.1
All other loans ................................... 40 757 69 2 0.21 0.8
Subtotal- 2009 to 2011 originations .................... 51 754 71 5 0.30 1.9
Loans originated — 2005 to 2008 ....................... 32 713 104 48 8.75 89.5
Loans originated — 2004 and prior ...................... 17 719 61 9 2.83 8.6
Total ............................................ 100% 735 80 20 3.58 100.0%
(1) Based on the loans remaining in the portfolio at December 31, 2012 and 2011, which totaled $1.6 trillion and $1.7 trillion, respectively, rather than all
loans originally guaranteed by us and originated in the respective year. Includes loans acquired under our relief refinance initiative, which began in 2009.
For credit scores, LTV ratios, serious delinquency rates, and other information about the loans in our single-family credit guarantee portfolio, see “RISK
MANAGEMENT — Credit Risk — Mortgage Credit Risk — Single-Family Mortgage Credit Risk.”
(2) Credit score data is based on FICO scores, which are ranked on a scale of approximately 300 to 850 points. Although we obtain updated credit
information on certain borrowers after the origination of a mortgage, such as those borrowers seeking a modification, the scores presented in this table
represent the credit score of the borrower at the time of loan origination and may not be indicative of the borrowers’ creditworthiness at December 31,
2012.
(3) We estimate current market values by adjusting the value of the property at origination based on changes in the market value of homes in the same
geographical area since origination. See endnote (4) to “Table 41 — Characteristics of the Single-Family Credit Guarantee Portfolio” for information on
our calculation of current LTV ratios.
(4) Calculated as a percentage of the aggregate UPB of loans with LTV ratios greater than 100% in relation to the total UPB of loans in the category.
(5) See “RISK MANAGEMENT — Credit Risk — Mortgage Credit Risk — Single-family Mortgage Credit Risk — Delinquencies” for further information
about our reported serious delinquency rates.
(6) Historical credit losses for each origination year may not be representative of future results.
Contracting the Dominant Presence of the GSEs in the Marketplace
We continue to take steps toward the goal of gradually shifting mortgage credit risk from Freddie Mac to private
investors, while simplifying and shrinking certain of our operations. In the case of single-family credit guarantees, we are
exploring several ways to accomplish this goal, including increasing guarantee fees and evaluating new risk-sharing
transactions beyond the traditional charter-required mortgage insurance coverage. Two across-the-board increases in
guarantee fees occurred in 2012, and FHFA has proposed additional fee adjustments, as discussed in “BUSINESS — Our
Business Segments — Single-Family Guarantee Segment —Overview of the Securitization Process.”
In the Investments segment, under the terms of the Purchase Agreement, as amended on August 17, 2012, and FHFA
regulation, the UPB of our mortgage-related investments portfolio: (a) could not exceed $650 billion on December 31, 2012;
and (b) on December 31 of each year thereafter, may not exceed 85% of the aggregate amount of the UPB we were permitted
to own as of December 31 of the immediately preceding calendar year, until the portfolio reaches $250 billion. This strategy
is designed to reduce the portfolio and provide the best return to the taxpayer while minimizing market disruption.
In the Multifamily segment, our primary business model is to purchase held-for-sale multifamily loans for aggregation and
then securitization through multifamily K Certificates, which are considered Other Guarantee Transactions. In substantially all
of these transactions we guarantee only the most senior tranches of the securities. As a result, a significant portion of our
expected credit risk associated with these loans is sold in subordinated tranches to third party investors.
8Freddie Mac