Fluor 2003 Annual Report Download - page 7
Download and view the complete annual report
Please find page 7 of the 2003 Fluor annual report below. You can navigate through the pages in the report by either clicking on the pages listed below, or by using the keyword search tool below to find specific information within the annual report.-
 1
1 -
 2
2 -
 3
3 -
 4
4 -
 5
5 -
 6
6 -
 7
7 -
 8
8 -
 9
9 -
 10
10 -
 11
11 -
 12
12 -
 13
13 -
 14
14 -
 15
15 -
 16
16 -
 17
17 -
 18
18 -
19
-
20
-
21
-
22
-
23
-
24
-
25
-
26
-
27
-
28
 |
 |

FL UOR C O RPO R AT ION 2003 A NNUAL REPORT
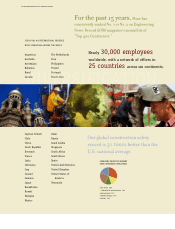
For the past 15 years, Fluor has
consistently ranked No. 1 or No. 2 on Engineering
News-Record (ENR) magazine’s annual list of
“Top 400 Contractors.”
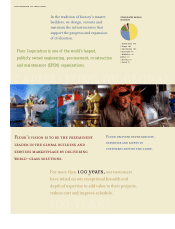
FLUOR HAS AN INTERNATIONAL PRESENCE
WITH OPERATIONS AROUND THE WORLD
Nearly 30,000employees
Argentina TheNetherlands
Australia Peru worldwide,withanetworkofofficesin
Azerbaijan Philippines 25countries acrosssixcontinents.
DIVERSIFICATION
Bahamas Poland
Brazil Portugal
Canada PuertoRico
CaymanIslands
Chile
China
CzechRepublic
Denmark
France
India
Indonesia
Iraq
Ireland
Jamaica
Japan
Kazakhstan
Kuwait
Malaysia
Mexico
Qatar
Russia
SaudiArabia
Singapore
SouthAfrica
SouthKorea
Spain
CONSOLIDATEDBACKLOG
BYREGION
UnitedArabEmirates
UnitedKingdom
UnitedStatesof
America
Venezuela
■UnitedStates 48%
■Europe 30%
■LatinAmerica 10%
■AsiaPacific 4%
■MiddleEast 4%
■ Africa 2%
■Australia 1%
■Canada1%
Our global construction safety
record is 50 times better than the
U.S. national average.
OPERATINGPROFITBYSEGMENT
FROMCONTINUINGOPERATIONS
■ Oil&Gas 30%
■ Industrial&Infrastructure 15%
■ Government 12%
■ GlobalServices 24%
■ Power 19%