Fluor 2003 Annual Report Download - page 20
Download and view the complete annual report
Please find page 20 of the 2003 Fluor annual report below. You can navigate through the pages in the report by either clicking on the pages listed below, or by using the keyword search tool below to find specific information within the annual report.-
 1
1 -
2
-
3
-
4
-
5
-
6
-
7
-
8
-
9
-
 10
10 -
 11
11 -
 12
12 -
 13
13 -
 14
14 -
 15
15 -
 16
16 -
 17
17 -
 18
18 -
 19
19 -
 20
20 -
 21
21 -
 22
22 -
 23
23 -
 24
24 -
 25
25 -
 26
26 -
 27
27 -
 28
28
 |
 |

0.0
0.5
1.0
1.5
2.0
2.5
3.0
3.5
4.0
4.0
3.0
2.0
1.0
0.0
NEW AWARDS & BACKLOG
dollars in billions
New Awards
Backlog
0
40
80
120
160
160.0
120.0
80.0
40.0
0.0
OPERATING PROFIT
dollars in millions
PERCENT OF TOTAL
OPERATING PROFIT
0
1
2
3
4
5
5.0
4.0
3.0
2.0
1.0
0.0
NEW AWARDS & BACKLOG
dollars in billions
New Awards
Backlog
0
30
60
90
120
120.0
90.0
60.0
30.0
0.0
OPERATING PROFIT
dollars in millions
PERCENT OF TOTAL
OPERATING PROFIT
0.0
0.5
1.0
1.5
2.0
2.0
1.5
1.0
0.5
0.0
NEW AWARDS & BACKLOG
dollars in billions
New Awards
Backlog
0
15
30
45
60
60.0
45.0
30.0
15.0
0.0
OPERATING PROFIT
dollars in millions
PERCENT OF TOTAL
OPERATING PROFIT
0.0
0.5
1.0
1.5
2.0
2.0
1.5
1.0
0.5
0.0
NEW AWARDS & BACKLOG
dollars in billions
New Awards
Backlog
0
25
50
75
100
100.0
75.0
50.0
25.0
0.0
OPERATING PROFIT
dollars in millions
PERCENT OF TOTAL
OPERATING PROFIT
Oil & Gas
30%
Industrial &
Infrastructure
15%
Government
12%
Global Services
24%
01 02 03
01 02 03
01 02 03
01 02 03
01 02 03
01 02 03
01 02 03
01 02 03
FL UOR CORPORATION 2003 A N NUAL REPORT
MARKETS SERVED
COGENERATION
FOSSILFUELS
SAMPLE CLIENTS
BRAZOSELECTRIC,DAYTONPOWER&
LIGHT,DUKEENERGY,FPLENERGY,
LG&E,PANDAENERGY,PSEG,
RELIANTENERGY,SCE&G,SEMPRA
POWER
Over the course of the investment cycle,
Fluor captured significant market share,
winning roughly one third of all new power
projects awarded in the U.S.
4
4.0
3
3.0
2
2.0
1
1.0
0
0.0
01 02 03
NEW AWARDS & BACKLOG
dollars in billions
New Awards
Backlog
120
120.0
90
90.0
60
60.0
30
30.0
0
0.0
01 02 03
OPERATING PROFIT
dollars in millions
PERCENT OF TOTAL
OPERATING PROFIT
Power
19%
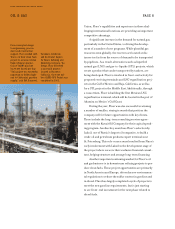
FLUOR’S POWER BUSINESS SEGMENT IS AN industry leader in providing state-
of-the-art power generation facilities for industrial
and commercial customers in the U.S. and abroad.
Deregulation in the U.S. electric power industry,
combined with strong growth in demand, drove a major
cycle of capital investment in recent years. Over the
course of the investment cycle that ended in early 2002,
Fluor captured significant market share, winning roughly
one third of all new power projects awarded in the U.S.
While awards for new projects were extremely modest in 2003, Fluor focused on executing
its strong backlog of power work, successfully completing six projects during the year and
generating $77 million in operating profit. Backlog for Power at the end of the year was
$605 million.