Fluor 2003 Annual Report Download - page 2
Download and view the complete annual report
Please find page 2 of the 2003 Fluor annual report below. You can navigate through the pages in the report by either clicking on the pages listed below, or by using the keyword search tool below to find specific information within the annual report.-
 1
1 -
 2
2 -
 3
3 -
 4
4 -
 5
5 -
 6
6 -
 7
7 -
 8
8 -
 9
9 -
 10
10 -
 11
11 -
 12
12 -
 13
13 -
14
-
15
-
16
-
17
-
18
-
19
-
20
-
21
-
22
-
23
-
24
-
25
-
26
-
27
-
28
 |
 |

9.0 8.8
128
170
17.0 18.5
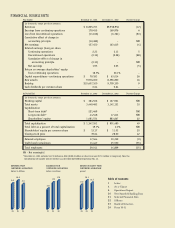
FINANCIAL HIGHLIGHTS
YearEnded December31,2003 December31,2002 PercentChange
(inthousands,exceptpershareamounts)
Revenues $ 8,805,703 $9,958,956 (12)
Earningsfromcontinuingoperations 179,455 169,976 6
Lossfromdiscontinuedoperations (11,616) (6,361) (83)
Cumulativeeffectofchangein
accountingprinciple (10,389) – NM
Netearnings 157,450 163,615 (4)
Dilutedearnings(loss)pershare
Continuingoperations 2.23 2.13 5
Discontinuedoperations (0.15) (0.08) (88)
Cumulativeeffectofchangein
accountingprinciple (0.13) – NM
Netearnings 1.95 2.05 (5)
Returnonaverageshareholders’equity
fromcontinuingoperations 18.5% 20.1% –
Capitalexpenditures–continuingoperations $ 79,183 $ 63,014 26
Newawards 9,976,000 8,596,800 16
Backlog $10,607,100 9,709,100 9
Cashdividendspercommonshare 0.64 0.64 –
AtPeriodEnd December31,2003 December31,2002 PercentChange
(inthousands,exceptpershareamounts)
Workingcapital
Totalassets
Capitalization
Short-termdebt*
Long-termdebt*
Shareholders’equity
$ 384,506
3,449,482
221,469
44,548
1,081,534
$ 167,921
3,142,151
–
17,613
883,867
NM
10
NM
NM
22
Totalcapitalization
Totaldebtasapercentoftotalcapitalization
Shareholders’equitypercommonshare
Closingstockprice
$
$
1,347,551
19.7%
13.17
39.64
$ 901,480
2.0%
$ 11.02
28.00
49
NM
20
42
Salariedemployees
Craft/hourlyemployees
17,564
11,447
19,259
25,550
(9)
(55)
Totalemployees 29,011 44,809 (35)
NM–Notmeaningful
*December31,2003includes$127.0millionindebt($100.0millioninshort-termand$27.0millioninlong-term)fromthe
consolidationofvariableinterestentitiesasprescribedbyFASBInterpretationNo.46.
REVENUESFROM EARNINGSFROM RETURNONEQUITYFROM
CONTINUINGOPERATIONS CONTINUINGOPERATIONS CONTINUINGOPERATIONS
dollarsinbillions dollarsinmillions percent
10.0 179 20.1
TableofContents
1 Letter
4 At-a-Glance
6 Operations Report
20 New Awards & Backlog Data
21 Selected Financial Data
22 Officers
23 Board of Directors
24 Form 10-K
01 02 03 01 02 03 01 02 03