Fifth Third Bank 2014 Annual Report Download - page 5
Download and view the complete annual report
Please find page 5 of the 2014 Fifth Third Bank annual report below. You can navigate through the pages in the report by either clicking on the pages listed below, or by using the keyword search tool below to find specific information within the annual report.-
 1
1 -
 2
2 -
 3
3 -
 4
4 -
 5
5 -
 6
6 -
 7
7 -
 8
8 -
 9
9 -
 10
10 -
 11
11 -
 12
12 -
 13
13 -
 14
14 -
 15
15 -
 16
16 -
17
-
18
-
19
-
20
-
21
-
22
-
23
-
24
-
25
-
26
-
27
-
28
-
29
-
30
-
31
-
32
-
33
-
34
-
35
-
36
-
37
-
38
-
39
-
40
-
41
-
42
-
43
-
44
-
45
-
46
-
47
-
48
-
49
-
50
-
51
-
52
-
53
-
54
-
55
-
56
-
57
-
58
-
59
-
60
-
61
-
62
-
63
-
64
-
65
-
66
-
67
-
68
-
69
-
70
-
71
-
72
-
73
-
74
-
75
-
76
-
77
-
78
-
79
-
80
-
81
-
82
-
83
-
84
-
85
-
86
-
87
-
88
-
89
-
90
-
91
-
92
-
93
-
94
-
95
-
96
-
97
-
98
-
99
-
100
-
101
-
102
-
103
-
104
-
105
-
106
-
107
-
108
-
109
-
110
-
111
-
112
-
113
-
114
-
115
-
116
-
117
-
118
-
119
-
120
-
121
-
122
-
123
-
124
-
125
-
126
-
127
-
128
-
129
-
130
-
131
-
132
-
133
-
134
-
135
-
136
-
137
-
138
-
139
-
140
-
141
-
142
-
143
-
144
-
145
-
146
-
147
-
148
-
149
-
150
-
151
-
152
-
153
-
154
-
155
-
156
-
157
-
158
-
159
-
160
-
161
-
162
-
163
-
164
-
165
-
166
-
167
-
168
-
169
-
170
-
171
-
172
-
173
-
174
-
175
-
176
-
177
-
178
-
179
-
180
-
181
-
182
-
183
-
184
-
185
-
186
-
187
-
188
-
189
-
190
-
191
-
192
 |
 |

2014 ANNUAL REPORT | 3
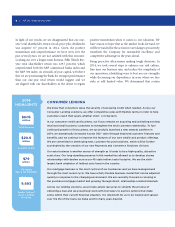
estimated Fifth Third’s liquidity coverage ratio (LCR)
to be above 110 percent, which currently compares
favorably with many similarly-sized banks and positions
us to be compliant with the Federal Banking Regulators’
LCR requirements.
Noninterest income decreased 23 percent from 2013,
reflecting the lower net benefit from our investment in
Vantiv and a 56 percent decline in mortgage banking net
revenue. Otherwise, fee income results were highlighted
by corporate banking revenue and categories that
exhibit less volatility like card and processing revenue,
investment advisory fees, and service charges on
deposits.
Our focus on expense management was evident and
represents another cornerstone of our strategy to
achieve our return targets. Total noninterest expense
declined 6 percent from 2013 despite a 4 percent
increase in technology and communications expense as
we continue to invest in our businesses.
Credit trends reflected our continued de-risking of the
business. Full year net charge-offs increased 15 percent
while nonperforming assets declined 24 percent from
2013. We reduced our loan loss reserves by $260 million;
although our coverage ratios remain solid at 1.47 percent
of loans and 228 percent of nonperforming loans.
Overall, we have good momentum in many of our core
businesses and believe we are taking appropriate steps
to position ourselves for long-term success.
is has proven to be a strategic advantage for us as we have
recognized approximately $3.2 billion in total pre-tax gains
from our sale of the processing business in 2009 to today,
including net gains of $227 million in 2014. We currently
own a 22.8 percent interest in Vantiv, whose market
capitalization was $5.8 billion at year-end. Fih ird has
beneted tremendously from its investment in Vantiv, and
while we would expect to manage our position downward
over time in a disciplined way, it continues to give us
signicant capital exibility.
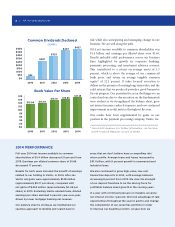
We increased our annual common dividend 9 percent from
2013, to a level consistent with the Federal Reserve’s near-
term dividend payout ratio guidance of 30 percent. Including
common stock repurchases, we returned $1.1 billion to
shareholders. We have reduced our share count by 4 percent
from year-end 2013 and grew tangible book value per share
by 11 percent. Despite these returns, our capital levels remain
very strong overall, with a Tier 1 common equity ratio* of
9.7 percent, up 20 basis points, and 9.4 percent as estimated
pro forma under the Basel III requirements.
* Non-GAAP measure. For further information, see the Non-
GAAP Financial Measures section of MD&A.
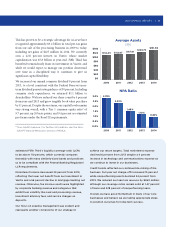
Average Assets
($B)
NPA Ratio
2010 2011 2012 2013 2014
2010 2011 2012 2013 2014
$140
$120
$100
$80
$60
$40
$20
$0
3.0%
2.5%
2.0%
1.5%
1.0%
0.5%
0.0%
$112.43
2.79%
$112.67
2.23%
$117.61
1.49%
$123.73
1.10%
$131.94
0.82%