Fifth Third Bank 2014 Annual Report Download - page 4
Download and view the complete annual report
Please find page 4 of the 2014 Fifth Third Bank annual report below. You can navigate through the pages in the report by either clicking on the pages listed below, or by using the keyword search tool below to find specific information within the annual report.-
 1
1 -
 2
2 -
 3
3 -
 4
4 -
 5
5 -
 6
6 -
 7
7 -
 8
8 -
 9
9 -
 10
10 -
 11
11 -
 12
12 -
 13
13 -
 14
14 -
 15
15 -
16
-
17
-
18
-
19
-
20
-
21
-
22
-
23
-
24
-
25
-
26
-
27
-
28
-
29
-
30
-
31
-
32
-
33
-
34
-
35
-
36
-
37
-
38
-
39
-
40
-
41
-
42
-
43
-
44
-
45
-
46
-
47
-
48
-
49
-
50
-
51
-
52
-
53
-
54
-
55
-
56
-
57
-
58
-
59
-
60
-
61
-
62
-
63
-
64
-
65
-
66
-
67
-
68
-
69
-
70
-
71
-
72
-
73
-
74
-
75
-
76
-
77
-
78
-
79
-
80
-
81
-
82
-
83
-
84
-
85
-
86
-
87
-
88
-
89
-
90
-
91
-
92
-
93
-
94
-
95
-
96
-
97
-
98
-
99
-
100
-
101
-
102
-
103
-
104
-
105
-
106
-
107
-
108
-
109
-
110
-
111
-
112
-
113
-
114
-
115
-
116
-
117
-
118
-
119
-
120
-
121
-
122
-
123
-
124
-
125
-
126
-
127
-
128
-
129
-
130
-
131
-
132
-
133
-
134
-
135
-
136
-
137
-
138
-
139
-
140
-
141
-
142
-
143
-
144
-
145
-
146
-
147
-
148
-
149
-
150
-
151
-
152
-
153
-
154
-
155
-
156
-
157
-
158
-
159
-
160
-
161
-
162
-
163
-
164
-
165
-
166
-
167
-
168
-
169
-
170
-
171
-
172
-
173
-
174
-
175
-
176
-
177
-
178
-
179
-
180
-
181
-
182
-
183
-
184
-
185
-
186
-
187
-
188
-
189
-
190
-
191
-
192
 |
 |

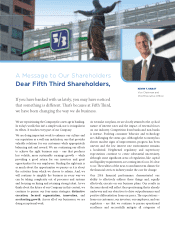
2 | FIFTH THIRD BANCORP
risk while also anticipating and managing change in our
business. We are well along the path.
2014 net income available to common shareholders was
$1.4 billion and earnings per diluted share were $1.66.
Results included solid performance across our business
lines highlighted by growth in corporate banking,
payments processing, and investment advisory revenue.
is contributed to a return on average assets of 1.1
percent, which is above the average of our commercial
bank peers, and return on average tangible common
equity* of 12.2 percent. It takes focused execution to
deliver on the promise of creating long-term value, and the
solid returns that we produced provide a good barometer
for our progress. Our persistent focus on the things we can
control and our day-to-day execution on the fundamentals
were evident as we strengthened the balance sheet, grew
net interest income, reduced expenses, and saw continued
improvement in credit metrics throughout the year.
Our results have been supplemented by gains on our
position in the payment processing company, Vantiv, Inc.
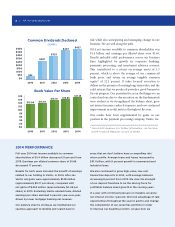
2014 PERFORMANCE
Full year 2014 net income available to common
shareholders of $1.4 billion decreased 21 percent from
2013. Earnings per diluted common share of $1.66
decreased 17 percent.
Results for both years included the benefit of earnings
related to our holding in Vantiv. In 2014, after-tax
Vantiv net gains were approximately $148 million
(approximately $0.17 per share), compared with
net gains of $403 million (approximately $0.45 per
share) in 2013. Excluding Vantiv-related items, diluted
earnings per share declined 5 percent year-over-year,
driven by lower motgage banking net revenue.
Our balance sheet is strong as we maintained our
cautious approach to lending and scaled back in
areas that we don’t believe have a compelling risk/
return profile. Average loans and leases increased to
$91.1 billion, with 9 percent growth in commercial and
industrial loans.
We also continued to grow high-value, low-cost
transaction deposits in 2014, with average balances
increasing 8 percent from 2013. We view the strength
of our deposit franchise to be the driving force for
profitable balance sheet growth in the coming years.
In a year with continued pressure on margins, we grew
net interest income 1 percent. We took advantage of rate
opportunities throughout the year to add to and change
the composition of our securities portfolio in order
to improve our liquidity position. At year-end, we
* Non-GAAP measure. For further information, see the Non-
GAAP Financial Measures section of MD&A.
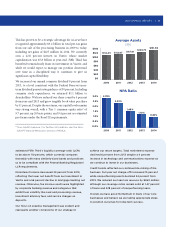
Book Value Per Share
2010 2011 2012 2013 2014
$18
$16
$14
$12
$10
$8
$6
$4
$2
$0
$13.06 $13.92
$15.10 $15.85 $17.35
Common Dividends Declared
($MM)
2010 2011 2012 2013 2014
$450
$400
$350
$300
$250
$200
$150
$100
$50
$0
$32
$257
$325
$407 $427