Fannie Mae 2002 Annual Report Download - page 3
Download and view the complete annual report
Please find page 3 of the 2002 Fannie Mae annual report below. You can navigate through the pages in the report by either clicking on the pages listed below, or by using the keyword search tool below to find specific information within the annual report.-
 1
1 -
 2
2 -
 3
3 -
 4
4 -
 5
5 -
 6
6 -
 7
7 -
 8
8 -
 9
9 -
 10
10 -
 11
11 -
 12
12 -
 13
13 -
 14
14 -
15
-
16
-
17
-
18
-
19
-
20
-
21
-
22
-
23
-
24
-
25
-
26
-
27
-
28
-
29
-
30
-
31
-
32
-
33
-
34
-
35
-
36
-
37
-
38
-
39
-
40
-
41
-
42
-
43
-
44
-
45
-
46
-
47
-
48
-
49
-
50
-
51
-
52
-
53
-
54
-
55
-
56
-
57
-
58
-
59
-
60
-
61
-
62
-
63
-
64
-
65
-
66
-
67
-
68
-
69
-
70
-
71
-
72
-
73
-
74
-
75
-
76
-
77
-
78
-
79
-
80
-
81
-
82
-
83
-
84
-
85
-
86
-
87
-
88
-
89
-
90
-
91
-
92
-
93
-
94
-
95
-
96
-
97
-
98
-
99
-
100
-
101
-
102
-
103
-
104
-
105
-
106
-
107
-
108
-
109
-
110
-
111
-
112
-
113
-
114
-
115
-
116
-
117
-
118
-
119
-
120
-
121
-
122
-
123
-
124
-
125
-
126
-
127
-
128
-
129
-
130
-
131
-
132
-
133
-
134
 |
 |

1
FANNIE MAE 2002 ANNUAL REPORT
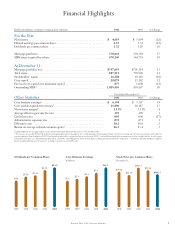
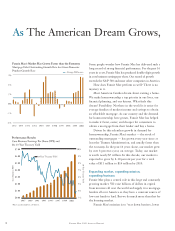
$1.20
$1.12
2001200019991998 2002 2001200019991998 2002 2001200019991998 2002
$1.08
$.96
$1.32 $6.4
$5.4
$4.4
$3.9
$3.4
$74.00
$62.44
$86.75
$79.50
$64.33
Core Business Earnings
In billions
Stock Price per Common Share
December 31,
Dividends per Common Share
Financial Highlights
Dollars in millions, except per common share amounts 2002 2001 % Change
For the Year
Net income . . . . . . . . . . . . . . . . . . . . . . . . . . . . . . . . . . . . . . . . . . . . . . . . . . . . . $ 4,619 $ 5,894 (22)
Diluted earnings per common share. . . . . . . . . . . . . . . . . . . . . . . . . . . . . . . . . . 4.53 5.72 (21)
Dividends per common share . . . . . . . . . . . . . . . . . . . . . . . . . . . . . . . . . . . . . . . 1.32 1.20 10
Mortgage purchases . . . . . . . . . . . . . . . . . . . . . . . . . . . . . . . . . . . . . . . . . . . . . . 370,641 270,584 37
MBS issues acquired by others . . . . . . . . . . . . . . . . . . . . . . . . . . . . . . . . . . . . . . 478,260 344,739 39
At December 31,
Mortgage portfolio, net. . . . . . . . . . . . . . . . . . . . . . . . . . . . . . . . . . . . . . . . . . . . $797,693 $705,324 13
Total assets. . . . . . . . . . . . . . . . . . . . . . . . . . . . . . . . . . . . . . . . . . . . . . . . . . . . . . 887,515 799,948 11
Stockholders’ equity . . . . . . . . . . . . . . . . . . . . . . . . . . . . . . . . . . . . . . . . . . . . . . 16,288 18,118 (10)
Core capital . . . . . . . . . . . . . . . . . . . . . . . . . . . . . . . . . . . . . . . . . . . . . . . . . . . . . 28,079 25,182 12
Excess of core capital over minimum capital. . . . . . . . . . . . . . . . . . . . . . . . . . . . 877 1,000 (12)
Outstanding MBS1. . . . . . . . . . . . . . . . . . . . . . . . . . . . . . . . . . . . . . . . . . . . . . . 1,029,456 858,867 20
Year Ended December 31,
Other Statistics 2002 2001 % Change
Core business earnings2 . . . . . . . . . . . . . . . . . . . . . . . . . . . . . . . . . . . . . . . . . . . $ 6,394 $ 5,367 19
Core taxable-equivalent revenues2. . . . . . . . . . . . . . . . . . . . . . . . . . . . . . . . . . . 11,896 10,187 17
Net interest margin2. . . . . . . . . . . . . . . . . . . . . . . . . . . . . . . . . . . . . . . . . . . . . . 1.15% 1.11% 4
Average effective guaranty fee rate . . . . . . . . . . . . . . . . . . . . . . . . . . . . . . . . . . . .191 .190 1
Credit loss ratio . . . . . . . . . . . . . . . . . . . . . . . . . . . . . . . . . . . . . . . . . . . . . . . . . . .005 .006 (17)
Administrative expense ratio . . . . . . . . . . . . . . . . . . . . . . . . . . . . . . . . . . . . . . . . .072 .071 1
Efficiency ratio . . . . . . . . . . . . . . . . . . . . . . . . . . . . . . . . . . . . . . . . . . . . . . . . . . 10.2 10.0 2
Return on average realized common equity2. . . . . . . . . . . . . . . . . . . . . . . . . . . 26.1 25.4 3
1Includes MBS and other mortgage-related securities guaranteed by Fannie Mae and held by investors other than Fannie Mae.
2These measures are non-GAAP (generally accepted accounting principles) measures management uses to track and analyze our financial performance. Core business earnings is presented on a net of tax basis and excludes the
transition adjustment from the adoption of FAS 133 and unrealized gains and losses on purchased options recorded under FAS 133, and includes purchased options premiums amortized on a straight-line basis over the original
estimated life of the option. See “Selected Financial Information: 1998-2002” and “Management’s Discussion and Analysis of Financial Condition and Results of Operations — Core Business Earnings and Business Segment
Results” for additional discussion of these measures, including reconciliation to our GAAP results.