Exxon 2009 Annual Report Download - page 20
Download and view the complete annual report
Please find page 20 of the 2009 Exxon annual report below. You can navigate through the pages in the report by either clicking on the pages listed below, or by using the keyword search tool below to find specific information within the annual report.-
 1
1 -
2
-
3
-
4
-
5
-
6
-
7
-
8
-
9
-
 10
10 -
 11
11 -
 12
12 -
 13
13 -
 14
14 -
 15
15 -
 16
16 -
 17
17 -
 18
18 -
 19
19 -
 20
20 -
 21
21 -
 22
22 -
 23
23 -
 24
24 -
 25
25 -
 26
26 -
 27
27 -
 28
28 -
 29
29 -
 30
30 -
31
-
32
-
33
-
34
-
35
-
36
-
37
-
38
-
39
-
40
-
41
-
42
-
43
-
44
-
45
-
46
-
47
-
48
-
49
-
50
-
51
-
52
-
53
 |
 |

EricWhetstone•WhetstoneDesignLab
office:214-788-6336•cell:
EDITOR
TraceyGunnlaugsson•InvestorRelations
ExxonMobilCorporation,Irving,TX
office:972-444-1151•cell:972-849-6202
fax:972-444-1505
tracey[email protected]
CarolZuber-Mallison•ZMGraphics
studio/cell:214-906-4162•fax:817-924-7784
Usage:ExclusiverightswithinExxonMobil
(c)2010,ZMGraphicsImagecannotberesold
ATTENTION:OWNER
Datalistisusedtodrivetheblackand
whitechart,whichisthenusedasa
templateforthecolorchart.Barsand
linesarecutandpastedfromtheblack
andwhitetemplateandarehighly
accurate.However,thecolorchartis
NOTlinkedtothedatabaseandisNOT
“driven”bythedata;itisapieceof
artworkbuiiltbyahuman.Therefore,the
editorneedstothoroughlyproofthefinal
artwork,notJUSTthedatalist.
VERSION
APPROVEDBY
Onderdonk/Corporate
StrategicPlanning
Feb.12,2010
FILEINFO
LASTFILECHANGEMADEBY
13A09XOMF-
DemandByFuel.ai
Carol James Bill
INF&OONPAGE
INSARONPAGE
Note:
S17A
Includeslinkfile
ISIN
SARandF&O
DATAasof02/03/2010
--Changedcolorstomatchthoseon11E
--Dataisthatbeingusedinthisyear’sEnergy
Outlookedition.(ProvidedthruJoshGoldberg,
--Lastyear’sdatawaschartedinmillions
ofoil-equivalentbarrelsperday.This
dataisthatusedinthisyear’sEnergyOutlook
editionandisinquadrillionBTUs.
CarolZ-M
0
100
200
300
2030
2005
EnergySavingsTotalEnergyGrowthWind,Solar,BiofuelsHydro,GeoNuclearBiomassGasCoalOil
ByFuel "2005" "2030" OECD NonOECD
Oil 171.1 206.9
Coal 112.3 127
Gas 100.4 156.9
Biomass 45.1 51.2
Nuclear 28.6 50.9
Hydro,Geo 11.8 20.1
Wind,Solar,Biofuels 1.5 15.4
TotalEnergyGrowth 157.6
EnergySavings 223.5 71.7
Annual
Energy
Savings
GrowthinEnergyDemandbyEnergySource
(quadrillion BTUs)
Annual Growth
2005–2030
Average 1.2%
300
200
100
0.5%
1.8%
0.5% 2.3%
2.2% 9.6%
Average
Growth Rate
Per Year
0.8%
Coal Gas Biomass,
Other
Nuclear Hydro,
Geo
Wind,
Solar,and
Biofuels
Oil 2030
OECD
Non-OECD
2005 2030
EricWhetstone•WhetstoneDesignLab
office:214-788-6336•cell:
EDITOR
TraceyGunnlaugsson•InvestorRelations
ExxonMobilCorporation,Irving,TX
office:972-444-1151•cell:972-849-6202
fax:972-444-1505
tracey[email protected]
CarolZuber-Mallison•ZMGraphics
studio/cell:214-906-4162•fax:817-924-7784
Usage:ExclusiverightswithinExxonMobil
(c)2010,ZMGraphicsImagecannotberesold
ATTENTION:OWNER
Datalistisusedtodrivetheblackand
whitechart,whichisthenusedasa
templateforthecolorchart.Barsand
linesarecutandpastedfromtheblack
andwhitetemplateandarehighly
accurate.However,thecolorchartis
NOTlinkedtothedatabaseandisNOT
“driven”bythedata;itisapieceof
artworkbuiiltbyahuman.Therefore,the
editorneedstothoroughlyproofthefinal
artwork,notJUSTthedatalist.
VERSION
APPROVEDBY
Onderdonk/Corporate
StrategicPlanning
Feb.18,2010
FILEINFO
LASTFILECHANGEMADEBY
13B09XOMF-
CO2Emissions.ai
Carol James Bill
INF&OONPAGE
INSARONPAGE
Note:
S17B
13B
Includeslinkfile
ISIN
SARandF&O
"2005' "2030"
1/1/80 10978 7634
1/1/81 10670 7580
1/1/82 10244 7764
1/1/83 10181 7965
1/1/84 10532 8216
1/1/85 10629 8409
1/1/86 10636 8742
1/1/87 10889 9114
1/1/88 11206 9482
1/1/89 11397 9720
1/1/90 11230 10104
1/1/91 11243 10194
1/1/92 11284 10043
1/1/93 11372 10014
1/1/95 11736 10380
1/1/96 12110 10556
1/1/97 12284 10584
1/1/98 12297 10666
1/1/99 12385 10723
1/1/00 12635 10852
1/1/01 12625 11026
1/1/02 12632 11404
1/1/03 12852 12286
1/1/04 12998 13340
1/1/05 13113 14087
1/1/06 13059 15000
1/1/07 13239 15678
1/1/08 13076 16082
1/1/09 12018 15692
1/1/10 12030 16254
1/1/12 12250 17202
1/1/13 12254 17604
1/1/16 12160 18587
1/1/17 12100 18889
1/1/18 12042 19186
1/1/20 11893 19788
1/1/30 11049 22795
Dataasof10/28/2009
Dataasof10/28/2009
"2005" "2030"
OECD 0.4083 0.2159
NonOECD 1.5554 0.7719
Dataasof10/28/2009
EmissionsperGDP
EmissionsperCapita
requiresartificial
0
10000
20000
30000
40000
1/1/30
1/1/20
1/1/101/1/091/1/081/1/071/1/061/1/051/1/041/1/031/1/021/1/011/1/001/1/901/1/80
0.0
0.5
1.0
2.0
2030
2005
--FYI:TheunitsweretonsinEnergyOutlook
section,nottonnes.(It’spossibletheywere
changedlaterbydesignerbutIdon’tthinkso...)
--DataliftedfromEnergyOutlookreport.
CZM
1980 2005 2030 05 30 05 30 05 30 05 30
Energy-RelatedCO2 Emissions
(billions of tonnes) (tonnes per person) (tonnes per thousand
dollars of GDP
in 2005 dollars)
40
30
20
10
2.0
1.5
1.0
0.5
12
10
8
6
4
2
CO2 Emissions Emissions per Capita Emissions per GDP
OECD Non-OECD
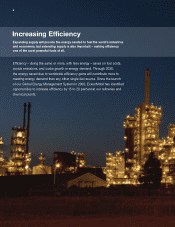
We also anticipate a shift away from coal toward less
carbon-intensive fuels including natural gas, nuclear, and
renewable fuels. By 2030, we expect that 40 percent of
the world’s electricity will be generated by nuclear and
renewable fuels.
Natural Gas to Meet a Rising Share of Energy Needs
Fossil fuels – oil, natural gas, and coal – will continue to
meet most of the world’s needs, accounting for nearly
80 percent of demand through 2030. No other energy
source can match their availability, versatility, affordability,
and scale.
Oil will still account for the largest share, but natural gas will
move into second place on very strong growth, driven by
increasing power generation needs and its ability to serve
as a reliable, affordable, and clean-burning energy source.
From 2005 to 2030, global demand for natural gas will
increase by about 55 percent.
An important supply development has been the expansion
of unconventional natural gas – the result of recent
improvements in technologies used to tap these hard-to-
produce resources. This is particularly the case in the United
States, where unconventional gas is expected to satisfy
more than 50 percent of gas demand in 2030. In addition,
worldwide demand for liquefied natural gas (LNG) will
continue to grow, led by Asia and Europe.
Nuclear power will also grow significantly to help meet
rising electricity demand. Wind, solar, and biofuels will grow
most rapidly through 2030, at nearly 10 percent a year on
average; however, even then their contribution will remain
relatively small at about 2.5 percent of total energy.
One of the most important “fuels” of all is energy efficiency.
In fact, the energy saved annually through improved
efficiency will reach about twice the growth in global energy
demand from 2005 to 2030.
Growing Global Energy Demand and CO2 Emissions
The outlook for energy-related carbon dioxide (CO
2
)
emissions is linked directly to the types and amounts of
energy required globally. In our view, global CO
2
emissions
are likely to rise by about 25 percent from 2005 to 2030.
While substantial, the rate of growth will be significantly
lower than for overall energy demand.
Importantly, the outlook for CO
2
emissions varies greatly
between OECD and non-OECD countries. Non-OECD
emissions surpassed OECD emissions in 2004. By 2030,
non-OECD countries will account for two-thirds of the
global total.
This outcome reflects our view that CO
2
emissions in the
OECD have already peaked and will decline by about
15 percent by 2030, reaching a level similar to that in 1980.
This will be a noteworthy achievement considering that
OECD economic output will have tripled from 1980 to 2030
and population will have grown by about 30 percent.
Providing Integrated Solutions
The scale of our economic, energy, and environmental
challenges is huge and growing. Solutions must include
expanding supplies, improving efficiency, and mitigating
emissions. Technology and diversity of economic supplies
of energy remain important. In addition, sensible and stable
policy environments will continue to be essential to stimulate
our creative human capacity and the huge investments
necessary to address these challenges.
For our part, ExxonMobil is making enormous investments
to provide solutions to help meet future energy demand.
We are confident that by steadfastly pursuing practical,
broad-based solutions, people around the world will
make great progress in meeting economic, energy, and
environmental challenges.
EXXONMOBILCORPORATION • 2009SUMMARYANNUALREPORT 17