Equifax 2012 Annual Report Download - page 20
Download and view the complete annual report
Please find page 20 of the 2012 Equifax annual report below. You can navigate through the pages in the report by either clicking on the pages listed below, or by using the keyword search tool below to find specific information within the annual report.-
 1
1 -
2
-
3
-
4
-
5
-
6
-
7
-
8
-
9
-
 10
10 -
 11
11 -
 12
12 -
 13
13 -
 14
14 -
 15
15 -
 16
16 -
 17
17 -
 18
18 -
 19
19 -
 20
20 -
 21
21 -
 22
22 -
 23
23 -
 24
24 -
 25
25 -
 26
26 -
 27
27 -
 28
28 -
 29
29 -
 30
30 -
31
-
32
-
33
-
34
-
35
-
36
-
37
-
38
-
39
-
40
-
41
-
42
-
43
-
44
-
45
-
46
-
47
-
48
-
49
-
50
-
51
-
52
-
53
-
54
-
55
-
56
-
57
-
58
-
59
-
60
-
61
-
62
-
63
-
64
-
65
-
66
-
67
-
68
-
69
-
70
-
71
-
72
-
73
-
74
-
75
-
76
-
77
-
78
-
79
-
80
 |
 |

18 Equifax 2012 Annual Report
Consolidated net income from continuing operations increased $40.6
million, or 17%, in 2012 compared to 2011 due primarily to an $18.0
million increase in operating income in 2012, driven by improvements
in four of our five business segments, and the $27.8 million loss
recorded on the Brazilian Transaction (reflected in other expense and
income tax expense, as previously described) in 2011, for which no
comparable losses were incurred in 2012.
Consolidated income from continuing operations decreased by $3.1
million, or 1%, in 2011, compared to the same period in 2010, due to
the $27.8 million loss recorded on the Brazilian Transaction (reflected
in other expense and income tax expense), partially offset by operat-
ing income growth of $41.0 million due to revenue growth, net of
associated income taxes. Consolidated income attributable to Equifax
decreased $33.8 million in 2011. In addition to improved operating
results and the loss on the Brazilian Transaction described above,
2010 consolidated income from continuing operations included
transaction gains from discontinued operations of $27.2 million which
did not recur in 2011.
Segment Financial Results
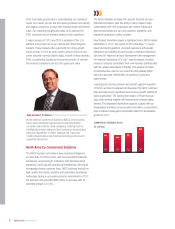
U.S. Consumer Information Solutions
U.S. Consumer Information Solutions Twelve Months Ended December 31, Change
2012 vs. 2011 2011 vs. 2010
(Dollars in millions) 2012 2011 2010 $% $%
Operating revenue:
Online Consumer Information Solutions $607.0 $519.8 $485.2 $ 87.2 17% $34.6 7%
Mortgage Solutions 161.0 119.5 113.5 41.5 35% 6.0 5%
Consumer Financial Marketing Services 148.8 153.3 144.3 (4.5) -3% 9.0 6%
Total operating revenue $916.8 $792.6 $743.0 $124.2 16% $49.6 7%
% of consolidated revenue 42% 40% 40%
Total operating income $341.7 $287.3 $269.8 $ 54.4 19% $17.5 6%
Operating margin 37.3% 36.2% 36.3% 1.1 pts -0.1 pts
U.S. Consumer Information Solutions revenue increased 16% in 2012
as compared to 2011 due to the impact of a high level of mortgage
activity as well as certain new product, pricing and market penetra-
tion initiatives implemented during 2011 and into 2012. We expect
that the additional revenue in 2013 resulting from the acquisition of
CSC Credit Services will more than offset an anticipated decline in
mortgage-related revenue as a result of an expected market decline
in mortgage origination volumes. The increase in revenue for 2011, as
compared to 2010, was a result of growth across all of our USCIS
business lines.
OCIS. 2012 revenue increased 17% when compared to the prior
year. About half of the increase resulted from increased volume and
improved pricing in mortgage end-use markets, while the other half
came predominately from pricing and new product initiatives. For the
year, core credit decision transaction volume increased by 4% while
average revenue per transaction increased by 9%, resulting from the
increase in mortgage volume (at higher than average pricing) as a
share of our overall mix and from specific market segment pricing
initiatives, while the remainder of our 17% growth came from
products billed on a subscription basis and other revenue sources.
The increase in revenue for 2011, as compared to 2010, was driven
by increased market volume, particularly in the credit card and auto
markets; new customer wins; new service introductions; and select
pricing actions in subscription and wholesale arrangements. An 11%
increase in core credit decision transaction volumes was partially
offset by lower average price per transaction for our transaction
based revenue.
Mortgage Solutions. Revenue increased 35% in 2012 when
compared to 2011 due primarily to increased sales in core mortgage
reporting services as a result of higher mortgage refinancings
stimulated by historically low mortgage interest rates; the sale of
newer mortgage information products which help lenders better man-
age risk; and growth in settlement services revenue as a result of the
favorable market conditions and increased market share from existing
customers. Revenue increased in 2011 primarily due to increased
sales of settlement services as a result of increased market share
from existing customers partially offset by the declines in core
mortgage reporting services due to lower refinancing activity as
compared to the comparable periods of 2010.
Consumer Financial Marketing Services. Revenue decreased in
2012, as compared to 2011, resulting from a decline in demand for
wealth-based consumer information services due to reductions in
their use for credit marketing by some large financial institutions. This
decrease was partially offset in by growth in traditional credit-based
pre-screen revenue and increased portfolio management revenue.
MANAGEMENT’S DISCUSSION AND ANALYSIS OF FINANCIAL CONDITION AND RESULTS OF OPERATIONS continued