Einstein Bros 2010 Annual Report Download - page 18
Download and view the complete annual report
Please find page 18 of the 2010 Einstein Bros annual report below. You can navigate through the pages in the report by either clicking on the pages listed below, or by using the keyword search tool below to find specific information within the annual report.-
 1
1 -
2
-
3
-
4
-
5
-
6
-
7
-
 8
8 -
 9
9 -
 10
10 -
 11
11 -
 12
12 -
 13
13 -
 14
14 -
 15
15 -
 16
16 -
 17
17 -
 18
18 -
 19
19 -
 20
20 -
 21
21 -
 22
22 -
 23
23 -
 24
24 -
 25
25 -
 26
26 -
 27
27 -
 28
28 -
29
-
30
-
31
-
32
-
33
-
34
-
35
-
36
-
37
-
38
-
39
-
40
-
41
-
42
-
43
-
44
-
45
-
46
-
47
-
48
-
49
-
50
-
51
-
52
-
53
 |
 |

Form 10-K
http://www.sec.gov/Archives/edgar/data/949373/000119312511067286/d10k.htm[9/11/2014 10:09:09 AM]
Income from operations
27,616
24,917
(9.8%)
6.7%
6.1%
Interest expense 5,439 6,114 12.4% 1.3% 1.5%
Income before income taxes 22,177 18,803 (15.2%) 5.4% 4.6%
Total provision (benefit) for income tax 2,468 (71,560) ** 0.6% (17.5%)
Net income $ 19,709 $ 90,363 ** 4.8% 22.1%
Adjustments to net income:
Interest expense, net 5,439 6,114 12.4%
Provision (benefit) for income taxes 2,468 (71,560) **
Depreciation and amortization 14,100 16,627 17.9%
Other operating expenses 461 725 57.3%
Earnings before interest, taxes, deprecation, amortization and other operating
expenses—Adjusted EBITDA $ 42,177 $ 42,269 0.2% 10.2% 10.3%
** not meaningful
System-wide comparable store sales decreased 2.4% in 2009. When the year began, we had negative 3.4% system-wide comparable store sales comprised of negative 8.1% in transactions and positive
5.2% for the average check related to a prior year price increase. By December of 2009 our system-wide comparable store sales were virtually flat at a negative 0.4% and negative 0.2% in both transactions and
average check. We achieved this improvement through our increased marketing initiatives, focused around our core breakfast product offerings as well as other value-oriented initiatives aimed at increasing
transactions and the frequency of guest visits. We believe that the difficult economic climate also put pressure on our catering sales as demand from our business customers declined.
Our gross profit margins in 2009 were pressured due primarily to the unfavorable deleveraging of certain operating expenses, higher health care benefit costs and the impact of increased investments in
marketing initiatives. During periods of lower sales, we typically experience deleveraging in those cost elements that are not fully variable to changes in sales. These costs include other operating expenses, rent
and related costs, and to a lesser extent, labor costs. Our health care benefit costs increased $1.9 million in 2009. We also continued to support our focus around our core breakfast offerings and other value-
oriented initiatives by increasing our investments in marketing by $2.3 million in 2009.
While our revenues declined in 2009 and our cost of sales reflected a $1.9 million increase in health care benefit costs, our focus on our cost initiatives resulted in our Adjusted EBITDA being virtually
flat in 2009 compared to 2008.
35
Table of Contents
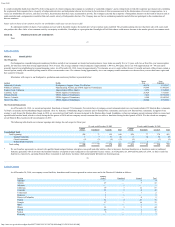
Company-Owned Restaurant Operations
Our company-owned restaurants vary in their unit volume, profitability and recent comparable store sales performance. As of December 29, 2009, we had 110 restaurants that generated an average unit
volume in excess of $1 million. These 110 restaurants had an average unit volume of approximately $1.2 million. In the aggregate, these restaurants contribute approximately 36% of total restaurant sales.
Company-owned restaurant sales for 2009 decreased, which was primarily related to the decline in our 2009 company-owned restaurant comparable store sales to a negative 3.4%. This was due to a
decrease in the number of transactions, and a slight decrease in our average check mostly due to greater coupon redemptions associated with our initiatives and a slightly unfavorable change in the mix of
products sold. This was partially offset by the modest price increases in 2009 at our Einstein Bros. and Noah’ s company-owned restaurants, compared to the price increases taken during 2008 and, on average, the
company-owned restaurants that were opened since late in 2008 until the end of 2009 had higher volumes than those that were closed over the same period, which positively contributed to our sales.
52 weeks ended
(dollars in thousands)
Increase/
(Decrease)
Percentage of company-owned
restaurant sales
December 30,
2008
December 29,
2009
2009
vs. 2008
December 30,
2008
December 29,
2009
Company-owned restaurant sales $ 376,664 $ 370,412 (1.7%)
Percent of total revenues 91.1% 90.7%
Cost of sales:
Cost of goods sold $ 112,675 $ 108,052 (4.1%) 29.9% 29.2%
Labor costs 112,007 113,665 1.5% 29.7% 30.7%
Rent and related expenses 38,389 40,517
Other operating costs 37,781 37,426 (0.9%) 10.0% 10.1%
Marketing costs 2,264 4,597 103.0% 0.6% 1.2%
Total company-owned restaurant cost of sales $ 303,116 $ 304,257 0.4% 80.5% 82.1%
Total company-owned restaurant gross profit $ 73,548 $ 66,155 (10.1%) 19.5% 17.9%
Comparable store sales for our company-owned restaurants for each quarter in 2008 and 2009, compared to the same periods in the previous year were as follows:
Fiscal 2008 Fiscal 2009 Change
First Quarter 3.6% -5.7% -9.3%
Second Quarter 1.0% -3.2% -4.2%
Third Quarter -1.7% -3.1% -1.4%
Fourth Quarter -3.3% -1.7% 1.6%
Annual -0.1% -3.4% -3.3%
Although we had a 1.7% decrease in company-owned revenues, we were able to control and lower our variable cost of goods sold by 4.1% to cause our cost of goods sold to decline from 29.9% to
29.2% as a percent of company-owned restaurant revenues.
Most of our commodity-based food costs decreased in 2009. Wheat represents the most significant raw ingredient we purchase. To mitigate the risk of increasing market prices, we have utilized a third
party advisor to manage our wheat purchases for our company-owned manufacturing facility. As a result of this relationship, our wheat costs declined throughout 2009. We will continue to work with our third
party advisor to strategically
36
Table of Contents
source our wheat purchases. However, there can be no assurance that we will benefit from a decline in the cost of any of the commodity-based products that we purchase.
Although our staffing costs declined in response to decreased traffic, our health care benefit costs increased and we added new catering personnel throughout 2009. In the fourth quarter of 2009 we
implemented a new on-line ordering system which allowed us to reduce our catering sales force at the end of the year. Total labor costs increased 1.0% as a percentage of company-owned restaurant sales in
2009.
During 2009, we doubled our investment in marketing to $4.6 million from $2.3 million in 2008. The increase was principally attributable to an investment in our marketing initiatives that we started
early in 2009, which were aimed at increasing transactions and launching of our new products.