Einstein Bros 2010 Annual Report Download - page 16
Download and view the complete annual report
Please find page 16 of the 2010 Einstein Bros annual report below. You can navigate through the pages in the report by either clicking on the pages listed below, or by using the keyword search tool below to find specific information within the annual report.-
 1
1 -
2
-
3
-
4
-
5
-
 6
6 -
 7
7 -
 8
8 -
 9
9 -
 10
10 -
 11
11 -
 12
12 -
 13
13 -
 14
14 -
 15
15 -
 16
16 -
 17
17 -
 18
18 -
 19
19 -
 20
20 -
 21
21 -
 22
22 -
 23
23 -
 24
24 -
 25
25 -
 26
26 -
27
-
28
-
29
-
30
-
31
-
32
-
33
-
34
-
35
-
36
-
37
-
38
-
39
-
40
-
41
-
42
-
43
-
44
-
45
-
46
-
47
-
48
-
49
-
50
-
51
-
52
-
53
 |
 |

Form 10-K
http://www.sec.gov/Archives/edgar/data/949373/000119312511067286/d10k.htm[9/11/2014 10:09:09 AM]
advertising and radio spots. We intend to expand on this media marketing in 2011 as we believe the increased marketing creates awareness of our brand which will help facilitate the trial of our products with
new customers and increase loyalty and frequency of our guests’ visits.
Manufacturing and Commissary Operations
52 weeks ended
(dollars in thousands)
Increase/
(Decrease)
Percentage of manufacturing
and commissary revenues
December 29,
2009
December 28,
2010
2010
vs. 2009
December 29,
2009
December 28,
2010
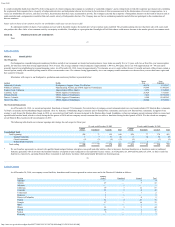
Manufacturing and commissary revenues $ 30,638 $ 30,405 (0.8%)
Percent of total revenues 7.5% 7.4%
Manufacturing and commissary costs $ 26,573 $ 25,566 (3.8%) 86.7% 84.1%
Total manufacturing and commissary gross profit $ 4,065 $ 4,839 19.0% 13.3% 15.9%
Manufacturing and commissary revenues for 2010 decreased $0.2 million compared to 2009. The modest decline was due to a decrease in third party domestic bagel sales, partially offset by a slight
increase in international bagel sales as well as growth in sales to our franchise and license locations. Manufacturing and commissary costs decreased substantially in 2010 as a result of lower raw ingredient costs
coupled with savings due to lower use taxes, maintenance and insurance costs for manufacturing and commissary locations, and continued efficiency improvements in our bagel manufacturing facility.
Franchise and License Operations
52 weeks ended
(dollars in thousands)
Increase/
(Decrease)
December 29,
2009
December 28,
2010
2010 vs.
2009
Franchise and license related revenues $ 7,512 $ 9,115 21.3%
Percent of total revenues 1.8% 2.2%
Number of franchise and license restaurants 255 302
31
Table of Contents
Overall, franchise and license revenue improvement of 21.3% from 2009 was driven by strong royalty streams that were a result of the net opening of 32 license locations and 15 franchise locations over
the last twelve months. For the fifty-two weeks ended December 28, 2010, franchise and license comparable store sales were a positive 2.7%.
Corporate Support
52 weeks ended
(dollars in thousands)
Increase/
(Decrease) Percentage of total revenues
December 29,
2009
December 28,
2010
2010
vs. 2009
December 29,
2009
December 28,
2010
(As Restated) (As Restated)
General and administrative expenses $ 35,463 $ 38,502 8.6% 8.7% 9.4%
Depreciation and amortization 16,627 17,769 6.9% 4.1% 4.3%
Restructuring expenses — 477 ** 0.0% 0.1%
Other operating expense (income) 725 (531) (173.2%) 0.2% (0.1%)
Total operating expenses $ 52,815 $ 56,217 6.4% 12.9% 13.7%
Interest expense, net 6,114 5,135 (16.0%) 1.5% 1.2%
Adjustment for Series Z modification — 929 ** 0.0% 0.2%
Write-off of debt issuance costs upon redemption of term loan — 966 ** 0.0% 0.2%
(Benefit) provision for income tax (71,560) 9,918 ** (17.5%) 2.4%
** Not meaningful
Our general and administrative expenses increased $3.0 million in 2010 compared to 2009 due to an increase of $1.8 million in incentive compensation as a result of the achievement of performance
targets in 2010 and $0.6 million in stock based compensation. We also incurred $0.5 million in severance expense related to a restructuring plan which was implemented late in 2010. We approved a plan to
reorganize the organization to align with our franchise growth model. This reorganization included eliminating certain duplicate positions and reducing headcount. We expect general and administrative expenses
for 2011 to be approximately $10.0 million per quarter.
Depreciation and amortization expenses increased $1.1 million or 6.9% in 2010 compared to 2009 due to additional assets invested in the company-owned restaurants that were added or upgraded in
2010. We expect depreciation expense for 2011 to be in the range of approximately $19 million to $21 million.
Interest expense, net decreased in 2010 primarily due to the expiration of the swap in August 2010 and a decrease in the Series Z additional redemption amounts of $0.4 million.
The components of our provision for income taxes are as follows:
December 29,
2009
December 28,
2010
(As Restated)
(in thousands)
Current
Total current income tax provision $ 198 $ 194
Deferred
Total deferred income tax provision 7,563 9,862
Change in valuation allowance (79,321) (138)
Total deferred income tax (benefit) provision (71,758) 9,724
Total income tax (benefit) provision $ (71,560) $ 9,918
32
Table of Contents
In 2009, we recorded a net deferred tax benefit of $71.8 million as restated, comprised of a $79.3 million reversal of substantially all of our valuation allowance as restated, partially offset by deferred tax
expense of $7.6 million as restated. In the third quarter of 2009, we reduced our $84.3 million valuation allowance by $79.3 million, as restated, to $4.9 million after concluding the likelihood for realization of
the benefits of our deferred tax assets is more likely than not. As discussed under “Restatement of Financial Information” above, the impact of the restatement on these items is $18.4 million in additional tax
benefit recorded in 2009.