Einstein Bros 2010 Annual Report Download - page 11
Download and view the complete annual report
Please find page 11 of the 2010 Einstein Bros annual report below. You can navigate through the pages in the report by either clicking on the pages listed below, or by using the keyword search tool below to find specific information within the annual report.-
 1
1 -
 2
2 -
 3
3 -
 4
4 -
 5
5 -
 6
6 -
 7
7 -
 8
8 -
 9
9 -
 10
10 -
 11
11 -
 12
12 -
 13
13 -
 14
14 -
 15
15 -
 16
16 -
 17
17 -
 18
18 -
 19
19 -
 20
20 -
 21
21 -
 22
22 -
23
-
24
-
25
-
26
-
27
-
28
-
29
-
30
-
31
-
32
-
33
-
34
-
35
-
36
-
37
-
38
-
39
-
40
-
41
-
42
-
43
-
44
-
45
-
46
-
47
-
48
-
49
-
50
-
51
-
52
-
53
 |
 |

Form 10-K
http://www.sec.gov/Archives/edgar/data/949373/000119312511067286/d10k.htm[9/11/2014 10:09:09 AM]
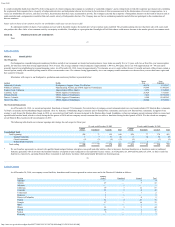
Measurement period - five years (1) (2)
Fiscal
2005
Fiscal
2006
Fiscal
2007
Fiscal
2008
Fiscal
2009
Fiscal
2010
BAGL $ 100.00 $ 166.67 $ 403.33 $ 118.67 $ 216.89 $ 305.56
PGI (3) $ 100.00 $ 112.29 $ 84.32 $ 69.75 $ 89.71 $ 123.24
NASDAQ $ 100.00 $ 107.65 $ 118.21 $ 69.11 $ 101.99 $ 118.47
(1) Assumes all distributions to stockholders are reinvested on the payment dates.
(2) Assumes $100 initial investment on January 3, 2006 in BAGL, the PGI, and the NASDAQ Composite Index.
(3) The PGI is a price-weighted index. The index includes:
• Panera Bread Company
• Starbucks Corporation
• Sonic Corporation
• Jack in the Box Incorporated
• AFC Enterprises Incorporated (Popeyes Chicken and Biscuits restaurant chain)
• YUM! Brands, Incorporated (A&W, KFC, Long John Silver’ s, Pizza Hut and Taco Bell restaurant chains)
• Wendy’ s
21
Table of Contents
ITEM 6. SELECTED FINANCIAL DATA
The following selected financial data for each fiscal year was extracted or derived from our consolidated financial statements and has been restated to reflect adjustments to the financial data that is
further discussed in the “Restatement of Financial Information” section in “Management’ s Discussion and Analysis of Financial Condition and Results of Operations” and in Note 3 in the Notes to Consolidated
Financial Statements.
Fiscal years ended:
January 2,
2007
(52 weeks)
January 1,
2008
(52 weeks)
December 30,
2008
(52 weeks)
December 29,
2009
(52 weeks)
December 28,
2010
(52 weeks)
(As Restated (4)) (As Restated (4)) (As Restated (4)) (As Restated (4))
(in thousands of dollars, except per share data and as otherwise indicated)
Selected Statements of Operations Data:
Revenues $ 389,962 $ 402,902 $ 413,450 $ 408,562 $ 411,711
Cost of goods sold 107,849 110,397 112,675 108,052 106,035
Labor costs 108,274 111,453 112,007 113,665 109,005
Rent and related expenses 34,690 36,289 38,389 40,517 39,731
Other operating costs 34,867 35,786 37,781 37,426 37,732
Marketing costs 4,496 3,255 2,264 4,597 9,854
Manufacturing and commissary costs 21,154 24,792 28,566 26,573 25,566
General and administrative expenses 37,484 40,635 36,356 35,463 38,502
California wage and hour settlements — — 1,900 — —
Senior management transition costs — — 1,335 — —
Restructuring expenses — — — — 477
Depreciation and amortization 16,949 11,192 14,100 16,627 17,769
Loss/(gain) on sale, disposal or abandonment of assets, net of gains 493 601 198 (93) (531)
Impairment charges and other related costs 2,268 236 263 818 —
Income from operations 21,438 28,266 27,616 24,917 27,571
Interest expense, net (1) 19,555 12,387 5,439 6,114 5,135
Write-off of debt issuance costs upon redemption of term loan 3,956 2,071 — — 966
Adjustment for Series Z Modification — — — — 929
(Loss) income before income taxes (6,868) 13,040 22,177 18,803 20,541
Provision (benefit) for income taxes 1,484 2,499 2,468 (71,560) 9,918
Net (loss) income $ (8,352) $ 10,541 $ 19,709 $ 90,363 $ 10,623
Net (loss) income $ (8,352) $ 10,541 $ 19,709 $ 90,363 $ 10,623
Less: Additional redemption on temporary equity — — — — (387)
Add: Accretion of premium on Series Z preferred stock — — — — 1,072
Net (loss) income available to common stockholders $ (8,352) $ 10,541 $ 19,709 $ 90,363 $ 11,308
Per share data:
Weighted average number of common shares outstanding—
Basic 10,356,415 13,497,841 15,934,796 16,175,391 16,532,420
Diluted 10,356,415 14,235,625 16,378,965 16,526,869 16,804,726
Net (loss) income available to common stockholders per share—
Basic $ (0.81) $ 0.78 $ 1.24 $ 5.59 $ 0.68
Diluted $ (0.81) $ 0.74 $ 1.20 $ 5.47 $ 0.67
Cash dividend declared per common share $ — $ — $ — $ — $ 0.125
Other Data:
Capital expenditures (2) $ 13,172 $ 25,869 $ 26,690 $ 16,898 $ 16,597
Percent increase (decrease) in system-wide comparable store sales (3) 4.7% 4.0% 1.4% (2.4%) 0.3%
Percent increase (decrease) in company owned restaurant comparable store
sales (3) 4.5% 3.7% (0.1%) (3.4%) (0.4%)
(1) Net interest expense is comprised of interest paid or payable in cash, Series Z Additional Redemption amounts, and non-cash interest expense resulting from the amortization of debt discount, notes paid -in-kind, debt issuance costs and the amortization of
warrants issued in connection with debt financings and interest income from our money market cash accounts.
(2) Excludes fixed asset purchases for which payment had not occurred as of each year end.