Einstein Bros 2010 Annual Report Download - page 17
Download and view the complete annual report
Please find page 17 of the 2010 Einstein Bros annual report below. You can navigate through the pages in the report by either clicking on the pages listed below, or by using the keyword search tool below to find specific information within the annual report.-
 1
1 -
2
-
3
-
4
-
5
-
6
-
 7
7 -
 8
8 -
 9
9 -
 10
10 -
 11
11 -
 12
12 -
 13
13 -
 14
14 -
 15
15 -
 16
16 -
 17
17 -
 18
18 -
 19
19 -
 20
20 -
 21
21 -
 22
22 -
 23
23 -
 24
24 -
 25
25 -
 26
26 -
 27
27 -
28
-
29
-
30
-
31
-
32
-
33
-
34
-
35
-
36
-
37
-
38
-
39
-
40
-
41
-
42
-
43
-
44
-
45
-
46
-
47
-
48
-
49
-
50
-
51
-
52
-
53
 |
 |

Form 10-K
http://www.sec.gov/Archives/edgar/data/949373/000119312511067286/d10k.htm[9/11/2014 10:09:09 AM]
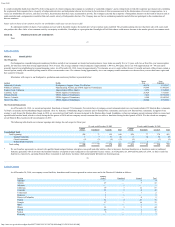
Reconciliation of Non-GAAP Measures to GAAP Measures
52 weeks ended
December 29,
2009
December 28,
2010
(As Restated)
(dollars in thousands)
Net income $ 90,363 $ 10,623
Adjustments to net income:
Interest expense, net 6,114 5,135
Provision (benefit) for income taxes (71,560) 9,918
Depreciation and amortization 16,627 17,769
Write-off of debt issuance costs upon redemption of term loan — 966
Adjustment for Series Z modification — 929
Restructuring expense — 477
Other operating expenses (income) 725 (531)
Adjusted EBITDA $ 42,269 $ 45,286
33
Table of Contents
EINSTEIN NOAH RESTAURANT GROUP, INC.
NON-GAAP FINANCIAL INFORMATION
52 weeks ended
December 29,
2009
December 28,
2010
(As Restated)
(in thousands, except earnings per share and
related share information)
Net income available to common stockholders $ 90,363 $ 11,308
Adjustments for:
Less: Change in tax valuation allowance (79,321) —
Add: Reversing effect of residual tax amount in other comprehensive income related to cash flow hedge — 500
Add: Write-off of debt issuance costs upon redemption of term loan — 966
Add: Restructuring expenses — 477
Less: Tax effects related to debt issuance costs and restructuring expenses — (564)
Add: Adjustment for Series Z modification — 929
Less: Accretion of premium on Series Z preferred stock — (1,072)
Less: Amortization of discount on Series Z preferred stock — 143
Adjusted net income $ 11,042 $ 12,687
Weighted average number of common shares outstanding:
Basic 16,175,391 16,532,420
Diluted 16,526,869 16,804,726
Net income per share available to common stockholders—Basic $ 5.59 $ 0.68
Adjustments for:
Less: Change in tax valuation allowance $ (4.91) $—
Add: Reversing effect of residual tax amount in other comprehensive income related to cash flow hedge $— $ 0.03
Add: Write-off of debt issuance costs upon redemption of term loan $— $ 0.06
Add: Restructuring expenses $— $ 0.02
Less: Tax effects related to debt issuance costs and restructuring expenses $— $ (0.03)
Add: Adjustment for Series Z modification $— $ 0.06
Less: Accretion of premium on Series Z preferred stock $— $ (0.06)
Less: Amortization of discount on Series Z preferred stock $— $ 0.01
Adjusted net income per common share—Basic $ 0.68 $ 0.77
Net income per share available to common stockholders—Diluted $ 5.47 $ 0.67
Adjustments for:
Less: Change in tax valuation allowance $ (4.80) $—
Add: Reversing effect of residual tax amount in other comprehensive income related to cash flow hedge $— $ 0.02
Add: Write-off of debt issuance costs upon redemption of term loan $— $ 0.06
Add: Restructuring expenses $— $ 0.02
Less: Tax effects related to debt issuance costs and restructuring expenses $— $ (0.04)
Add: Adjustment for Series Z modification $— $ 0.06
Less: Accretion of premium on Series Z preferred stock $— $ (0.05)
Less: Amortization of discount on Series Z preferred stock $— $ 0.01
Adjusted net income per common share—Diluted $ 0.67 $ 0.75
34
Table of Contents
Results of Operations for 2009 as compared to 2008
Consolidated Results
52 weeks ended
(dollars in thousands)
Increase/
(Decrease)
Percentage of
total revenues
December 30,
2008
December 29,
2009
2009
vs. 2008
December 30,
2008
December 29,
2009
(As Restated) (As Restated) (As Restated) (As Restated)
Revenues $ 413,450 $ 408,562 (1.2%)
Cost of sales 331,682 330,830 (0.3%) 80.2% 81.0%
Total gross profit 81,768 77,732 (4.9%) 19.8% 19.0%
Operating expenses 54,152 52,815 (2.5%) 13.1% 12.9%