EMC 2004 Annual Report Download - page 19
Download and view the complete annual report
Please find page 19 of the 2004 EMC annual report below. You can navigate through the pages in the report by either clicking on the pages listed below, or by using the keyword search tool below to find specific information within the annual report.-
 1
1 -
2
-
3
-
4
-
5
-
6
-
7
-
8
-
 9
9 -
 10
10 -
 11
11 -
 12
12 -
 13
13 -
 14
14 -
 15
15 -
 16
16 -
 17
17 -
 18
18 -
 19
19 -
 20
20 -
 21
21 -
 22
22 -
 23
23 -
 24
24 -
 25
25 -
 26
26 -
 27
27 -
 28
28 -
 29
29 -
30
-
31
-
32
-
33
-
34
-
35
-
36
-
37
-
38
-
39
-
40
-
41
-
42
-
43
-
44
-
45
-
46
-
47
-
48
-
49
-
50
-
51
-
52
-
53
-
54
-
55
-
56
-
57
-
58
-
59
-
60
-
61
-
62
-
63
-
64
-
65
-
66
-
67
-
68
-
69
-
70
-
71
-
72
-
73
-
74
-
75
-
76
-
77
-
78
-
79
-
80
-
81
-
82
-
83
-
84
-
85
-
86
-
87
-
88
-
89
-
90
-
91
-
92
-
93
-
94
-
95
-
96
-
97
-
98
-
99
-
100
-
101
-
102
-
103
-
104
-
105
-
106
-
107
-
108
-
109
-
110
-
111
-
112
-
113
-
114
-
115
-
116
-
117
-
118
-
119
-
120
-
121
-
122
-
123
-
124
-
125
-
126
-
127
-
128
 |
 |

Table of Contents
ITEM 7. MANAGEMENT'S DISCUSSION AND ANALYSIS OF FINANCIAL CONDITION AND RESULTS OF OPERATIONS
This Management's Discussion and Analysis of Financial Condition and Results of Operations should be read in conjunction with our consolidated financial
statements and notes thereto which appear elsewhere in this Annual Report on Form 10-K. The following discussion contains forward-looking statements and
should also be read in conjunction with "FACTORS THAT MAY AFFECT FUTURE RESULTS" beginning on page 33. The forward-looking statements do
not include the potential impact of any mergers, acquisitions, divestitures or business combinations that may be completed after the date hereof.
All dollar amounts in this MD&A are in millions, except per share amounts
INTRODUCTION
Our financial objective is to achieve profitable growth. Management believes that by providing a combination of systems, software, services and solutions
to meet customers' needs, we will be able to further increase revenues. Our operating income as a percentage of revenues increased from 6.4% for 2003 to
12.7% for 2004. Our efforts in 2003 and 2004 have been primarily focused on improving operating margins by increasing gross margins and reducing
operating expenses. Additionally, we have been expanding our portfolio of offerings to satisfy our customers' requirements. Our gross margins have increased
from 39.0% in 2002 to 51.2% in 2004. We have increased our overall investment in R&D from $781.5 in 2002 to $847.9 in 2004. These R&D expenditures
have enabled us to introduce new and enhanced product and service offerings. Our selling, general and administrative expenses, as a percentage of revenue,
have decreased from 30.9% in 2002 to 27.5% in 2004. Our R&D expenses, as a percentage of revenue, have decreased from 14.4% in 2002 to 10.3% in 2004.
We plan to continue to focus our efforts in 2005 on improving our operating and gross margins and expanding our product offerings.
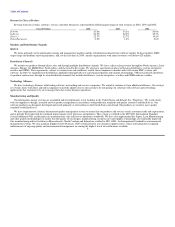
RESULTS OF OPERATIONS
The following table presents certain consolidated statement of operations information stated as a percentage of total revenues. Certain columns may not
add due to rounding.
2004 2003 2002
Total revenue 100.0% 100.0% 100.0%
Cost and expenses
Cost of sales 48.8 54.4 61.0
Gross margin 51.2 45.6 39.0
Research and development 10.3 11.5 14.4
Selling, general and administrative 27.5 26.6 30.9
Restructuring and other special charges 0.7 1.1 2.8
Operating income (loss) 12.7 6.4 (9.1)
Investment income, interest expense and other expense, net 1.7 2.7 3.6
Income (loss) before income taxes 14.4 9.2 (5.5)
Provision (benefit) for income taxes 3.8 1.2 (3.3)
Net income (loss) 10.6% 8.0% (2.2)%
16