E-Z-GO 2010 Annual Report Download - page 3
Download and view the complete annual report
Please find page 3 of the 2010 E-Z-GO annual report below. You can navigate through the pages in the report by either clicking on the pages listed below, or by using the keyword search tool below to find specific information within the annual report.-
 1
1 -
 2
2 -
 3
3 -
 4
4 -
 5
5 -
 6
6 -
 7
7 -
 8
8 -
 9
9 -
 10
10 -
 11
11 -
 12
12 -
 13
13 -
 14
14 -
15
-
16
-
17
-
18
-
19
-
20
-
21
-
22
-
23
-
24
-
25
-
26
-
27
-
28
-
29
-
30
-
31
-
32
-
33
-
34
-
35
-
36
-
37
-
38
-
39
-
40
-
41
-
42
-
43
-
44
-
45
-
46
-
47
-
48
-
49
-
50
-
51
-
52
-
53
-
54
-
55
-
56
-
57
-
58
-
59
-
60
-
61
-
62
-
63
-
64
-
65
-
66
-
67
-
68
-
69
-
70
-
71
-
72
-
73
-
74
-
75
-
76
-
77
-
78
-
79
-
80
-
81
-
82
-
83
-
84
-
85
-
86
-
87
-
88
-
89
-
90
-
91
-
92
-
93
-
94
-
95
-
96
-
97
-
98
-
99
-
100
-
101
-
102
-
103
-
104
-
105
-
106
 |
 |

1
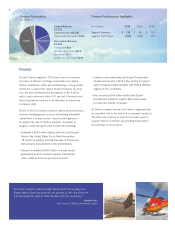
With a recovering global economy, many of our businesses
demonstrated improved performance in 2010. At Bell,
the team delivered another year of solid execution, with
an increase in overall revenues and double-digit profi t
margins. Volume increased in our Industrial segment—
largely driven by the return of the global automotive
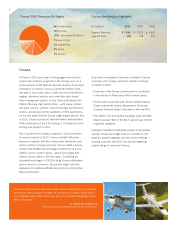
market—which led to improved profi tability. Cessna
continued to work through a tough cycle in the aviation
industry; however, there were positive indications of
recovery in the fourth quarter with the delivery of 79
business jets out of 179 total deliveries for the year.
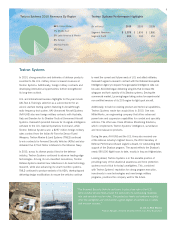
At Textron Systems, we saw the continued steady
delivery of our armored security vehicles, unmanned
aircraft systems and technology solutions that support
today’s armed forces.
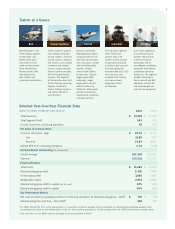
Our manufacturing businesses ended 2010 up slightly from
last year with $10.3 billion in revenues and a profi t of $790
Fellow Shareholders:
million for these segments. For the year, we realized $692
million in free cash fl ow1—compared to $424 million in 2009.
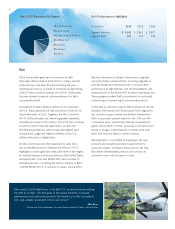
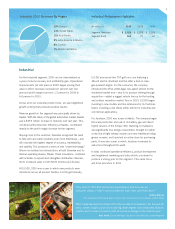
In our Finance segment, we made excellent progress with
our fi nance receivables liquidation begun in 2009. In 2010,
we reduced our fi nance receivables by $2.4 billion and
generated $2.2 billion in net cash from the liquidation
of fi nance assets.
Overall, this performance allowed us to take a number of
positive actions in 2010. We continued to strengthen our
balance sheet and reduced our consolidated net debt2 to
$5.0 billion—down from $7.4 billion last year and from
$11.9 billion in 2008.
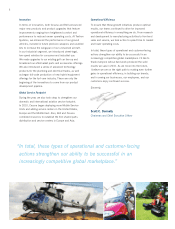
Key to growth in 2010 and beyond, we accelerated
activities around the quantity and pace of new product
development, as well as the expansion of our distribution
channels and service footprint.
1, 2 Free cash fl ow and net debt are non-GAAP measures. See page 10 for reconciliations to GAAP.