E-Z-GO 2010 Annual Report Download
Download and view the complete annual report
Please find the complete 2010 E-Z-GO annual report below. You can navigate through the pages in the report by either clicking on the pages
listed below, or by using the keyword search tool below to find specific information within the annual report.
-

1
-

2
-
3
-
4
-
5
-
6
-
7
-
8
-
9
-
10
-
11
-

12
-
13
-
14
-
15
-
16
-
17
-
18
-
19
-
20
-
21
-
22
-
23
-
24
-
25
-
26
-
27
-
28
-
29
-
30
-
31
-
32
-
33
-
34
-
35
-
36
-
37
-
38
-
39
-
40
-
41
-
42
-
43
-
44
-
45
-
46
-
47
-
48
-
49
-
50
-
51
-
52
-
53
-
54
-
55
-
56
-
57
-
58
-
59
-
60
-
61
-
62
-
63
-
64
-
65
-
66
-
67
-
68
-
69
-
70
-
71
-
72
-
73
-
74
-
75
-
76
-
77
-
78
-
79
-
80
-
81
-
82
-
83
-
84
-
85
-
86
-
87
-
88
-
89
-
90
-
91
-
92
-
93
-
94
-
95
-
96
-
97
-
98
-
99
-
100
-
101
-
102
-
103
-
104
-
105
-
106
Table of contents
-
Page 1
-
Page 2
$10.5 32,000 25
Billion Company Employees Countries
Textron is known around the world for its powerful brands of aircraft, defense and industrial products that provide customers with groundbreaking technologies, innovative solutions and ï¬rst-class service.
-
Page 3
...sheet and reduced our consolidated net debt2 to $5.0 billion-down from $7.4 billion last year and from $11.9 billion in 2008. Key to growth in 2010 and beyond, we accelerated activities around the quantity and pace of new product development, as well as the expansion of our distribution channels and...
-
Page 4
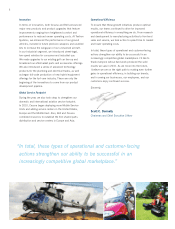
... our ability to be successful in an increasingly competitive global marketplace. I'd like to thank everyone whose hard work produced the solid results we saw in 2010. As we move into the future, I believe we are on the right path to making even further gains in operational efï¬ciency; in building...
-
Page 5
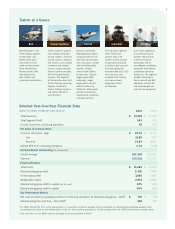
... Bell helicopters and E-Z-GO and Jacobsen golf cars and turf-care equipment.
Selected Year-Over-Year Financial Data
(Dollars in millions, except per share amounts)
2010 $ 10,525 $ 553 92 $ 25.30 $ 15.88 23.64 0.30 302,555 275,739 $ 15,282 $ 2,302 3,660 2,972 32% 44% $ 730 $ 692
2009...
-
Page 6
...the U.S. Navy approved full-rate production of the AH-1Z attack helicopter in 2010. Together, the AH-1Z and the UH-1Y utility helicopter are delivering ...Bell expanded its sales force and accelerated business development efforts in 2010. Highlights include signiï¬cant deals with three of the largest...
-
Page 7
... company well for the future. During the year, AAI-UAS and the U.S. Army also received one of the defense industry's highest honors, the 2010 Secretary of Defense Performance-Based Logistics Award, for outstanding ï¬eld support of the Shadow program. The award reï¬,ects the Shadow's nearly 590,000...
-
Page 8
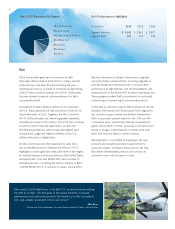
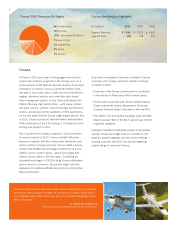
...& Mexico 7% Asia Paciï¬c 3% Middle East 2% Africa 1% Canada
Cessna
At Cessna, 2010 was a year of taking aggressive action to position the company for growth in the coming ...• The Citation CJ3 and Citation Sovereign made the Robb Report's annual "Best of the Best" special issue for their respective...
-
Page 9
...These innovations, combined with activities to expand and strengthen distribution channels, led to increased sales in both North America and Europe. At E-Z-GO, 2010 was a year in which new products were introduced across all product families. For the golf industry, E-Z-GO announced two TXT golf cars...
-
Page 10
...cash conversion ratio of 91 percent. Proceeds from these liquidations continue to be allocated to reduce the company's debt. Efforts in 2010 to ensure a vibrant captive ï¬nance business involved leveraging prior success at obtaining affordable capital from a unique source-export credit agencies- to...
-
Page 11
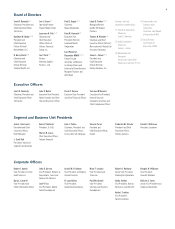
9
Board of Directors
Scott C. Donnelly (1) Chairman, President and Chief Executive Ofï¬cer Textron Inc. Kathleen M. Bader (2,3) President and Chief Executive Ofï¬cer (Retired) NatureWorks LLC R. Kerry Clark (2,4) Chairman and Chief Executive Ofï¬cer (Retired) Cardinal Health, Inc. Ivor J. Evans ...
-
Page 12
...flow measure may not be comparable with similarly titled measures reported by other companies, as there is no definitive accounting ...policies, less cash and equivalents. Our calculation of net debt is provided below:
(In millions)
2010
$5,962 - - (931) $5,031
2009
$ 9,251 31 - (1,892) $ 7,390
...
-
Page 13
UNITED STATES SECURITIES AND EXCHANGE COMMISSION Washington, D.C. 20549
Form 10-K
[ x ] ANNUAL REPORT PURSUANT TO SECTION 13 OR 15(d) OF THE SECURITIES EXCHANGE ACT OF 1934 For the fiscal year ended January 1, 2011 or ] TRANSITION REPORT PURSUANT TO SECTION 13 OR 15(d) OF THE SECURITIES EXCHANGE ...
-
Page 14
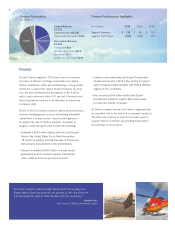
...the Consolidated Financial Statements on pages 80 and 82 of this Annual Report on Form 10-K. The following description of our business should.... Revenues for Cessna's principal lines of business were as follows:
(In millions) 2010 2009 2008
Aircraft sales Aftermarket
$ 1,896 667 $ 2,563
$ 2,733 587...
-
Page 15
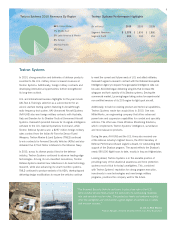
... performance, price, product quality and reliability, product support and reputation. Revenues by Textron Systems' product lines were as follows:
(In millions) 2010 2009 2008
Unmanned Aircraft Systems Land and Marine Systems Weapons and Sensors Mission Support and Other
$
785 503 284 407 $ 1,979...
-
Page 16
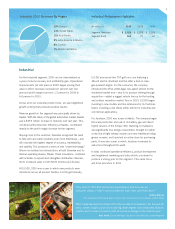
... lines. Industrial segment revenues were as follows:
(In millions) 2010 2009 2008
Fuel systems and functional components Golf and turf care ... accounted for approximately 16%, 12% and 13% of our total revenues in 2010, 2009 and 2008, respectively. Our automotive products have a limited number of...
-
Page 17
... U.S. primarily finance purchases of Textron-manufactured products for purchasers who have had difficulty in accessing other sources of financing. In 2010, 2009 and 2008, our Finance group paid our Manufacturing group $0.4 billion, $0.6 billion and $1.0 billion, respectively, related to the sale of...
-
Page 18
...are not included in the above table. U.S. Government Contracts In 2010, approximately 34% of our consolidated revenues were generated by or ...trademarks, trade names and service marks are used in this Annual Report on Form 10-K and other reports, including: AAI; AH-1Z; BA609; Bell/Agusta Aerospace ...
-
Page 19
... Information We make available free of charge on our Internet Web site (www.textron.com) our Annual Report on Form 10-K, Quarterly Reports on Form 10-Q, Current Reports on Form 8-K and amendments to those reports filed or furnished pursuant to Section 13(a) or 15(d) of the Securities Exchange Act of...
-
Page 20
... may impact our business, financial condition or results of operations, perhaps materially. We have customer concentration with the U.S. Government. During 2010, we derived approximately 34% of our revenues from sales to a variety of U.S. Government entities. Our ability to compete successfully for...
-
Page 21
organized in five major areas: affordability and cost growth; productivity and innovation; competition; services acquisition; and processes and bureaucracy. These new initiatives are expected to impact significantly the contracting environment in which we do business with our DoD customers, and they...
-
Page 22
delinquencies and foreclosures as customers elect to discontinue payments on loan balances that exceed asset values. Bankruptcy proceedings involving our borrowers may prevent or delay our ability to exercise our rights and remedies and realize the full value of our collateral. Our losses may ...
-
Page 23
Developing new products and technologies entails significant risks and uncertainties. To continue to grow our revenues and segment profit, we must successfully develop new products and technologies or modify our existing products and technologies for our current and future markets. Our future ...
-
Page 24
... Corporation, a subsidiary of Textron Inc. that is the borrower under the Economic Development Canada Bank (EDC) facility entered into on August 6, 2010, would be included within the cross-default provision of the supplemental indenture for the convertible notes, although not within the similar...
-
Page 25
...on plan assets, the discount rate used for future payment obligations and the rates of future cost growth. Additionally, as part of our annual evaluation of these plans, significant changes in our assumptions, due to changes in economic, legislative and/or demographic experience or circumstances, or...
-
Page 26
... to dismiss the remaining counts of the amended complaint, and that motion is still pending. As previously reported in Textron's Annual Report on Form 10-K for the fiscal year ended January 2, 2010, on August 21, 2009, a purported class action lawsuit was filed in the United States District Court in...
-
Page 27
...holders during the last quarter of the period covered by this Annual Report on Form 10-K.
Executive Officers of the Registrant
The following ...our common stock as reported on the New York Stock Exchange and the dividends paid per share are provided in the following table:
2010 High Low Dividends per...
-
Page 28
....40 122.16 149.34 113.34
2008 $ 38.35 76.96 94.77 54.97
2009 $ 52.43 97.33 118.12 60.55
2010 $ 66.16 111.99 135.98 71.87
16
-
Page 29
..., 2009 and 2008, respectively, primarily related to severance and asset impairment charges. In addition, in the third quarter of 2010, special charges include a $91 million non-cash pre-tax charge to reclassify a foreign exchange loss from equity to the income statement as a result of substantially...
-
Page 30
... to continue to invest in products and technologies that will position us for future growth as the economy recovers. We completed our restructuring program in 2010, which has driven out costs in all of our segments. Since the inception of the program in late 2008, we have lowered our headcount by...
-
Page 31
... and at Corporate, along with the decision to exit a plant in the Industrial segment. With the completion of this program at the end of 2010, we have terminated approximately 12,100 positions worldwide representing approximately 28% of our global workforce since the inception of the program and have...
-
Page 32
...group of $24 million, primarily due to the full year impact in 2010 of Convertible Notes issued in May 2009. In 2009, consolidated interest expense ... as it liquidated receivables.
Segment Analysis
We operate in, and report financial information for, the following five business segments: Cessna, Bell...
-
Page 33
...Inflation, net of pricing Sale of CESCOM assets Total change
$
$
(253) 95 (19) (50) (227)
Cessna's segment profit decreased $227 million, 115%, in 2010, compared with 2009, due to the $253 million impact from lower volume, a nonrecurring $50 million gain on the 2009 sale of CESCOM assets and $19...
-
Page 34
... and the H-1 helicopters, which are both in the production stage and represent a significant portion of Bell's revenues from the U.S. Government. During 2010, we have continued to ramp up production and deliveries to meet customer schedule requirements for these programs. Bell Revenues and Operating...
-
Page 35
...favorable impact from efficiencies realized in connection with the ramp-up of production lines, $21 million in profit recognized in the second quarter of 2010 related to the reimbursement of prior year costs and $14 million of lower material costs; and An $18 million net improvement from unfavorable...
-
Page 36
... lines. Textron System's operating expenses increased $90 million, 5%, in 2010, compared with 2009, primarily due to higher net sales volume and ... (14) (5) (10)
Segment profit at Textron Systems decreased $10 million in 2010, 4%, compared with 2009, as the $26 million impact of the higher UAS volume...
-
Page 37
... impact of $15 million, largely due to fluctuations with the euro. The Industrial segment's operating expenses increased $311 million, 15%, in 2010, compared with 2009, primarily due to higher sales volumes and inflation, partially offset by improved cost performance, largely due to the significant...
-
Page 38
...in lower impairment charges in the structured capital portfolio, $23 million in gains on the sale of two distribution finance receivable portfolios in 2010 and a $21 million decrease in discounts taken on the sale or early termination of finance assets associated with the liquidation of distribution...
-
Page 39
...15.57% 32.80% 5.49% 9.17% $ 569 119 112
At the end of 2010, finance receivables included $1.9 billion in finance receivables held for investment in the non-captive business,... the non-captive business totaled $0.4 billion at the end of 2010, compared with $0.8 billion at the end of 2009. These ...
-
Page 40
... We measure the success of the exit plan based on the percentage of total finance receivable and other finance asset reductions converted to cash. In 2010, we had a cash conversion ratio of 93%, compared with 95% in 2009, on our non-captive finance receivables. We expect the cash conversion ratio to...
-
Page 41
... these policies. Dividend payments to shareholders totaled $22 million, $21 million and $284 million in 2010, 2009 and 2008, respectively. The decrease in 2009 from 2008 payments was due to a reduction in the annual per share dividend to $0.08 in 2009 from $0.92 in 2008. We have not repurchased any...
-
Page 42
... tax refund of $75 million, compared with tax payments of $52 million in 2008, which was partially offset by lower fee income in 2010 due to the wind-down of the non-captive business. Cash receipts from the collection of finance receivables continued to outpace finance receivable originations, which...
-
Page 43
...two borrowing groups, there is no cash transaction reported in the consolidated cash flows at the time ...
270 (349) 40 - (39) 98
$
625 (142) - - 483 190
In 2010 and 2009, captive finance receivable originations have decreased largely due to lower aircraft sales. Consolidated Discontinued ...
-
Page 44
...years. Our policy for funding pension plans is to make contributions annually, consistent with applicable laws and regulations; however, future contributions ...following table summarizes the known contractual obligations, as defined by reporting regulations, of our Finance group as of January 1, 2011...
-
Page 45
... and collateral values. We classify accounts as watchlist based on credit quality indicators discussed in Note 4 to the Consolidated Financial Statements. In 2010 and 2009, net charge-offs totaled $138 million and $115 million, respectively, compared with the provision for losses recorded during the...
-
Page 46
...characteristics to the reporting unit being assessed. Based on our annual review, the fair value of all of our reporting units exceeded their ... lower expected rate of return on plan assets will increase pension expense. For 2010, the assumed expected long-term rate of return on plan assets used in ...
-
Page 47
...postretirement liabilities. The 2010 medical and prescription drug healthcare cost trend rates represent the weighted-average annual projected rate of ...our evaluation of the facts, circumstances and information available at the reporting date. For those tax positions for which it is more likely ...
-
Page 48
... using discounted cash flow analysis and indicative market pricing as reported by leading financial news and data providers. This sensitivity analysis...rates and a 10% strengthening in exchange rates against the U.S. dollar:
2010 Sensitivity of Fair Value to a 10% Change 2009 Sensitivity of Fair Value...
-
Page 49
... in this Annual Report on Form 10-K on the pages indicated below.
Page
Report of Management Reports of Independent ...2011 Notes to the Consolidated Financial Statements Supplementary Information: Quarterly Data for 2010 and 2009 (Unaudited) Schedule II - Valuation and Qualifying Accounts
38 39...
-
Page 50
...Management Management is responsible for the integrity and objectivity of the financial data presented in this Annual Report on Form 10-K. The Consolidated Financial Statements have been prepared in conformity with U.S. generally accepted accounting principles and include amounts based on management...
-
Page 51
...Inc. maintained, in all material respects, effective internal control over financial reporting as of January 1, 2011, based on the COSO criteria. We ...Sheets of Textron Inc. as of January 1, 2011 and January 2, 2010, and the related Consolidated Statements of Operations, Shareholders' Equity and Cash...
-
Page 52
Report of Independent Registered Public Accounting Firm To the Board of Directors and Shareholders of Textron Inc. We have audited the accompanying Consolidated Balance Sheets of Textron Inc. as of January 1, 2011 and January 2, 2010... 1, 2011 and January 2, 2010 and the consolidated results of ...
-
Page 53
...of Operations For each of the years in the three-year period ended January 1, 2011
(In millions, except per share data) 2010 2009 2008
Revenues Manufacturing revenues Finance revenues Total revenues Costs, expenses and other Cost of sales Selling and administrative expense Special charges Provision...
-
Page 54
Consolidated Balance Sheets
(In millions, except share data)
January 1, 2011
January 2, 2010
Assets Manufacturing group Cash and equivalents Accounts receivable, net Inventories Other current assets Total current assets Property, plant and equipment, net Goodwill Other assets Total ...
-
Page 55
... common stock for employee stock plans Redemption of preferred stock Income tax impact of employee stock transactions Balance at January 2, 2010 Net income Other comprehensive income (loss): Foreign currency translation adjustment Deferred gains on hedge contracts Pension adjustments Recognition of...
-
Page 56
...) in cash and equivalents Cash and equivalents at beginning of year Cash and equivalents at end of year See Notes to the Consolidated Financial Statements. 2010 $ 86 (6) 92 Consolidated 2009 $ (31) 42 (73) $ 2008 486 162 324
- - 393 143 112 8 19 69 109 (1) (10) 36 54 (455) 424 - 993 (9 ) 984 (450...
-
Page 57
... of year Cash and equivalents at end of year See Notes to the Consolidated Financial Statements. Manufacturing Group 2010 2009 2008 $ 314 (6) 320 $ 175 42 133 $ 947 162 785 $ 2010 (228) - (228) Finance Group 2009 $ (206) - (206) $ 2008 (461) - (461)
505 (383) 362 - - - 18 131 110 (1) (11) 9 54...
-
Page 58
... within operating cash flows as a cash inflow. Although cash is transferred between the two borrowing groups, there is no cash transaction reported in the consolidated cash flows at the time of the original financing. These captive financing activities, along with all significant intercompany...
-
Page 59
... an entity in which we have an equity interest. We account for this alliance as a collaborative arrangement with Bell and Boeing reporting costs incurred and revenue generated from transactions with the U.S. Government in each company's respective income statement. Neither Bell nor Boeing is...
-
Page 60
Finance receivables held for sale are carried at the lower of cost or fair value. At the time of transfer to held for sale classification, we establish a valuation allowance for any shortfall between the carrying value, net of all deferred fees and costs, and fair value. In addition, any allowance ...
-
Page 61
...future discounted cash flows. Goodwill We evaluate the recoverability of goodwill annually in the fourth quarter or more frequently if events or changes... indicate that the carrying value of a reporting unit might be impaired. The reporting unit represents the operating segment unless discrete ...
-
Page 62
...as incurred. Our research and development costs are as follows:
(In millions) 2010 2009 2008
Company-funded Customer-funded Total research and development
$ $
403 ...reflect the effects of temporary differences between the financial reporting carrying amounts of assets and liabilities and their tax ...
-
Page 63
...sale of the Fluid & Power business unit, previously reported in the Industrial segment, and recorded an after-tax... (134) - (169) (2) 1,698 (80) 2 2 1,622 22 (12) $ 1,632
In 2010, we acquired four companies in the Bell, Textron Systems and Industrial segments for aggregate proceeds of $57 million and...
-
Page 64
...101 34 19 561
$
$
(77) (43) (14) (15) (149)
$ 330 58 20 4 $ 412
Amortization expense totaled $52 million, $52 million and $53 million in 2010, 2009 and 2008, respectively. Amortization expense is estimated to be approximately $52 million, $50 million, $46 million, $41 million and $40 million in...
-
Page 65
... debt in Note 8. Thirdparty investors have no legal recourse to TFC beyond the credit enhancement provided by the assets of the SPEs. In 2010, we sold $655 million of finance receivables resulting in net gains of $31 million. Credit Quality Indicators and Nonaccrual Finance Receivables We internally...
-
Page 66
..., partially offset by new finance receivables identified as nonaccrual in 2010. We measure delinquency based on the contractual payment terms of...contractually due payment is delinquent, the entire finance receivable balance is reported in accordance with the most past-due delinquency aging category. ...
-
Page 67
...excluding leveraged leases, and related allowance for losses at the end of 2010 and 2009 is provided below:
(In millions) Aviation Golf Golf Other... 89 58 46 104 3 79
254 330 261 951 1,057 191 1,012
For the year ended January 2, 2010
$
258 258 46 98
$
3 3 1 1
$
179 179 32 96
$
354 366 59 234...
-
Page 68
... is presented below. The finance receivables reported in the following table specifically exclude $279... 342 191 151 $ 946 2,988 $ 3,934
$
164 1,956 $ 2,120
$ $
$ $
$ $
$ $
For the year ended January 2, 2010
$
$
29 111 (26) 114 46 68
$
$
9 9 (9) 9 1 8 3 330 333
$
$
52 45 (32) 65 32 33 ...
-
Page 69
... 2,125 506 3,415 (1,138) $ 2,277
$
735 1,861 613 3,209 (936) $ 2,273
Inventories valued by the LIFO method totaled $1.3 billion at the end of 2010 and 2009, and the carrying values of these inventories would have been approximately $441 million and $414 million, respectively, higher had our LIFO...
-
Page 70
... Deferred revenues Retirement plans Restructuring Other Total accrued liabilities Changes in our warranty and product maintenance contract liability are as follows:
(In millions) 2010
$
715 275 242 161 82 62 479 $ 2,016
$
791 244 263 72 85 51 533 $ 2,039
2009
2008
Accrual at beginning of year...
-
Page 71
...$
1,635 419 52 578 111 10 222 1,740 559 300 41 5,667
In 2010 and 2009, finance subsidiaries of Textron Inc. entered into three separate credit agreements with the...in committed bank lines of credit are due in April 2012. During 2010, Textron Inc. paid off the outstanding balance on its line of ...
-
Page 72
...June 30, 2009 and only during such calendar quarter if the last reported sale price of our common stock for at least 20 trading days ... least 20 trading days during the 30 consecutive trading days ended December 31, 2010. Accordingly, the notes are convertible at the holder's option through March 31,...
-
Page 73
...charge coverage ratio required by the Support Agreement and to maintain the leverage ratio required by its credit facility. Cash payments of $383 million in 2010 and $270 million in 2009 were paid to TFC to maintain compliance with the fixed charge coverage ratio. In addition, we paid $63 million on...
-
Page 74
... offset by the translation of the related foreign currency denominated assets and liabilities. For these instruments, the Finance group reported losses of $11 million in 2010 and $106 million in 2009 in selling and administrative expenses, which were largely offset by gains resulting from the...
-
Page 75
...translation adjustment account within OCI, produced a $26 million after-tax gain in 2010, resulting in an accumulated net gain balance of $14 million at January ...by the counterparties to our derivative agreements at the end of 2010 is minimal. We do not anticipate nonperformance by counterparties in...
-
Page 76
...-range forecast that was submitted to management in connection with our annual strategic planning process. This information indicated a more delayed recovery from previous estimates for the Golf and Turf Care reporting unit, as the economic recovery was proceeding slower than originally anticipated...
-
Page 77
... data for similar transactions. At January 1, 2011 and January 2, 2010, approximately 33% and 54%, respectively, of the fair value of...2,060 - 362 242,041
Reserved Shares of Common Stock At the end of 2010, common stock reserved for the conversion of convertible debt, the exercise of outstanding ...
-
Page 78
... stock Diluted weighted-average shares outstanding
274,452 27,450 653 302,555
262,923 - - 262,923
246,208 - 4,130 250,338
In 2010 and 2008, stock options to purchase 7 million and 8 million shares, respectively, of common stock outstanding are excluded from our calculation of diluted weighted...
-
Page 79
...15 21 (1,321) (100) 74 31 $ (1,316)
Special charges included restructuring charges of $99 million, $237 million and $64 million in 2010, 2009 and 2008, respectively. In 2010, special charges also included a $91 million non-cash pre-tax charge to reclassify a foreign exchange loss from equity to the...
-
Page 80
... and at Corporate, along with the decision to exit a plant in the Industrial segment. With the completion of this program at the end of 2010, we have terminated approximately 12,100 positions worldwide representing approximately 28% of our global workforce since the inception of the program and have...
-
Page 81
...80 million for the Golf and Turf Care reporting unit, which is part of our Industrial ...required to defer annual incentive compensation in excess of 100% of the executive's annual target into a ... granted per share was $7, $2 and $14 for 2010, 2009 and 2008, respectively. We estimate the fair value...
-
Page 82
...assumptions used in our Black-Scholes option-pricing model for awards issued during the respective periods are as follows:
2010 2009 2008
Dividend yield Expected volatility Risk-free interest rate Expected term (in years)
0.4% 37.0% 2.6% 5.5
1.4% 50.0% 2.0% 5.0
1.7% 30.0% 2.8% 5.1
The following...
-
Page 83
...paid or accrued until vested, and is remeasured at each reporting period date. The 2010 activity for our performance share units is as follows:
... 1, 2010, the Textron Retirement Plan was closed to new participants. Employees hired after January 1, 2010 will receive an additional 4% annual cash...
-
Page 84
... significant number of our U.S.-based employees participate. Our defined contribution plans cost approximately $95 million, $96 million and $110 million in 2010, 2009 and 2008, respectively; these amounts include $25 million, $28 million and $28 million, respectively, in contributions to the RAP. We...
-
Page 85
... the fair value of plan assets, along with our funded status, are as follows:
Postretirement Benefits Other than Pensions 2010 2009
(In millions)
Pension Benefits 2010 2009
Change in benefit obligation Benefit obligation at beginning of year Service cost Interest cost Amendments Plan participants...
-
Page 86
...50% - - 5.50% -
6.25% - - 5.50% -
6.00% - - 6.25% -
2010
2009
Medical cost trend rate Prescription drug cost trend rate Rate to which medical and prescription drug cost trend rates... rates have a significant effect on the amounts reported for the postretirement benefits other than pensions. A...
-
Page 87
...Corporate debt Asset-backed securities Private equity partnerships Real estate Hedge funds Total
January 2, 2010
$
3 1,052 688
$
178 469 251
$
324 337 101 762 313 301... every three years, which then are updated at least annually by the real estate investment manager, who considers current ...
-
Page 88
...of year Actual return on plan assets: Related to assets still held at reporting date Related to assets sold during the period Purchases, sales and settlements, net... used to measure our benefit obligation at the end of fiscal 2010. While pension benefit payments primarily will be paid out of qualified...
-
Page 89
...the facts, circumstances and information available at the reporting date. For those tax positions for which ...fluctuate significantly on a quarterly and annual basis. Our unrecognized tax benefits represent.... Unrecognized tax benefits were reduced in 2010, primarily due to an international related ...
-
Page 90
... is provided. The following table presents the breakdown between current and long-term net deferred tax assets:
(In millions) January 1, 2011 January 2, 2010
Current Non-current Finance group's net deferred tax liability Net deferred tax asset We have net operating loss and credit carryforwards at...
-
Page 91
...2012, $38 million for 2013, $31 million for 2014, $27 million for 2015 and a total of $152 million thereafter. Loan Commitments At January 2, 2010, the Finance group had $192 million of unused commitments primarily to fund new and existing customers under revolving lines of credit. These commitments...
-
Page 92
...group of $32 million, $3 million and $3 million in 2010, 2009 and 2008, respectively. In 2010, taxes paid, net of refunds received for the Finance .... Note 17. Segment and Geographic Data We operate in, and report financial information for, the following five business segments: Cessna, Bell,...
-
Page 93
... 86
$
198 304 240 27 (294) 475 (317) (164) (143) $ (149)
$
905 278 251 67 (50) 1,451 (526) (171) (125) $ 629
(In millions)
2010
Revenues 2009
2008
Fixed-wing aircraft Rotor aircraft Unmanned aircraft systems, armored security vehicles, precision weapons and other Fuel systems and functional...
-
Page 94
... below is selected financial information of our continuing operations by geographic area:
Revenues* (In millions) 2010 2009 2008 Property, Plant and Equipment, net** January 1, January 2, 2011 2010
United States Europe Canada Latin America and Mexico Asia and Australia Middle East and Africa...
-
Page 95
...quarter of 2009, special charges include a goodwill impairment charge of $80 million in the Industrial segment. (b) For the first and third quarters of 2010 and the second and fourth quarters of 2009, the potential dilutive effect of stock options, restricted stock units and the shares that could be...
-
Page 96
Schedule II - Valuation and Qualifying Accounts
(In millions) 2010 2009 2008
Allowance for doubtful accounts Balance at beginning of year $ 23 $ 24 $ 29 Charged to costs and expenses 2 8 5 Deductions from reserves* (5) (9) (10) Balance at ...
-
Page 97
...Shareholders to be held on April 27, 2011 is incorporated by reference into this Annual Report on Form 10-K. Information regarding our executive officers is contained in Part I of this Annual Report on Form 10-K.
Item 11. Executive Compensation
The information appearing under "ELECTION OF DIRECTORS...
-
Page 98
...Exhibit 3.2 to Textron's Quarterly Report on Form 10-Q for the fiscal quarter ended April 3, 2010. Indenture dated as of ...Performance Share Unit Grant Agreement. Incorporated by reference to Exhibit 10.1H to Textron's Annual Report on Form 10-K for the fiscal year ended January 3, 2009. 86
3.2
4.1A...
-
Page 99
... Severance Plan for Textron Key Executives, As Amended and Restated Effective January 1, 2010. Incorporated by reference to Exhibit 10.10 to Textron's Annual Report on Form 10-K for the fiscal year ended January 2, 2010. First Amendment to the Severance Plan for Textron Key Executives, dated October...
-
Page 100
... October 27, 2004. Confidential treatment has been requested for portions of this agreement. Incorporated by reference to Exhibit 10.26 to Textron's Annual Report on Form 10-K for the fiscal year ended January 1, 2005. * Amendment No. 4 to Master Services Agreement between Textron Inc. and Computer...
-
Page 101
...Textron Inc. and Computer Sciences Corporation, dated as of September 30, 2010. * Convertible Bond Hedge Transaction Confirmation, dated April 29, 2009, between...Textron. Incorporated by reference to Exhibit 10.12 to Textron's Current Report on Form 8-K filed May 5, 2009. Computation of ratio of ...
-
Page 102
....
32.2
101
Signatures
Pursuant to the requirement of Section 13 or 15(d) of the Securities Exchange Act of 1934, the registrant has duly caused this Annual Report on Form 10-K to be signed on its behalf by the undersigned, thereunto duly authorized on this 1st day of March 2011. TEXTRON INC...
-
Page 103
Pursuant to the requirements of the Securities Exchange Act of 1934, this Annual Report on Form 10-K has been signed below on this 1st day of March 2011 by the following persons on behalf of the registrant and in ...
-
Page 104
... our website at www.textron.com. Company Publications and General Information To receive a copy of Textron's Forms 10-K and 10-Q, Proxy Statement or Annual Report without charge, visit our website at www.textron.com, call (888) TXT-LINE or send a written request to Textron Investor Relations at the...
-
Page 105
www.textron.com
Design: www.csg-design.com
-
Page 106
Textron Inc. 40 Westminster Street Providence, RI 02903 (401) 421-2800 www.textron.com