Dollar Tree 2008 Annual Report Download - page 19
Download and view the complete annual report
Please find page 19 of the 2008 Dollar Tree annual report below. You can navigate through the pages in the report by either clicking on the pages listed below, or by using the keyword search tool below to find specific information within the annual report.-
 1
1 -
2
-
3
-
4
-
5
-
6
-
7
-
8
-
 9
9 -
 10
10 -
 11
11 -
 12
12 -
 13
13 -
 14
14 -
 15
15 -
 16
16 -
 17
17 -
 18
18 -
 19
19 -
 20
20 -
 21
21 -
 22
22 -
 23
23 -
 24
24 -
 25
25 -
 26
26 -
 27
27 -
 28
28 -
 29
29 -
30
-
31
-
32
-
33
-
34
-
35
-
36
-
37
-
38
-
39
-
40
-
41
-
42
-
43
-
44
-
45
-
46
-
47
-
48
-
49
-
50
-
51
-
52
 |
 |

DOLLAR TREE, INC. • 2008 ANNUAL REPORT
17
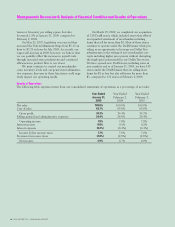
Fiscal year ended January 31, 2009 compared to fiscal year
ended February 2, 2008
Net Sales. Net sales increased 9.5%, or $402.3 million,
in 2008 compared to 2007, resulting from sales in our
new and expanded stores and a 4.1% increase in com-
parable store net sales. Comparable store net sales are
positively affected by our expanded and relocated
stores, which we include in the calculation, and, to a
lesser extent, are negatively affected when we open
new stores or expand stores near existing ones.
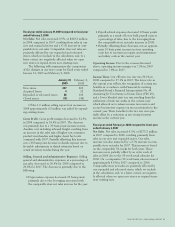
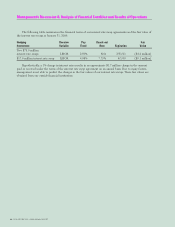
The following table summarizes the components
of the changes in our store count for fiscal years ended
January 31, 2009 and February 2, 2008.
January 31, February 2,
2009 2008
New stores 227 208
Acquired leases 432
Expanded or relocated stores 86 102
Closed stores (51) (48)
Of the 1.9 million selling square foot increase in
2008 approximately 0.3 million was added by expand-
ing existing stores.
Gross Profit. Gross profit margin decreased to 34.3%
in 2008 compared to 34.4% in 2007. The decrease
was primarily due to a 30 basis point increase in mer-
chandise cost, including inbound freight, resulting from
an increase in the sales mix of higher cost consumer
product merchandise and higher diesel fuel costs
compared with 2007. Partially offsetting this increase
was a 20 basis point decrease in shrink expense due to
favorable adjustments to shrink estimates based on
actual inventory results during the year.
Selling, General and Administrative Expenses. Selling,
general and administrative expenses, as a percentage of
net sales, decreased to 26.4% for 2008 compared to
26.6% for 2007. The decrease is primarily due to the
following:
• Depreciation expense decreased 25 basis points
primarily due to the leveraging associated with
the comparable store net sales increase for the year.
• Payroll-related expenses decreased 10 basis points
primarily as a result of lower field payroll costs as
a percentage of sales, due to the leveraging from
the comparable store net sales increase in 2008.
• Partially offsetting these decreases was an approxi-
mate 10 basis point increase in store operating
costs due to increases in repairs and maintenance
and utility costs in the current year.
Operating Income. Due to the reasons discussed
above, operating income margin was 7.9% in 2008
compared to 7.8% in 2007.
Income Taxes. Our effective tax rate was 36.1% in
2008 compared to 37.1% in 2007. The lower rate in
the current year reflects the recognition of certain tax
benefits in accordance with Financial Accounting
Standards Board’s Financial Interpretation No. 48,
Accounting for Uncertainty in Income Taxes (FIN 48),
and a lower blended state tax rate resulting from the
settlement of state tax audits in the current year
which allowed us to release income tax reserves and
accrue less interest expense on tax uncertainties in the
current year. These benefits to the tax rate were par-
tially offset by a reduction in tax-exempt interest
income in the current year.
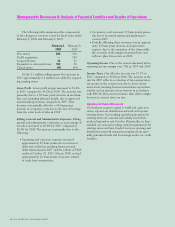
Fiscal year ended February 2, 2008 compared to fiscal year
ended February 3, 2007
Net Sales. Net sales increased 6.9%, or $273.2 million,
in 2007 compared to 2006, resulting primarily from
sales in our new and expanded stores. Our sales
increase was also impacted by a 2.7% increase in com-
parable store net sales for 2007. This increase is based
on the comparable 52-weeks for both years. These
increases were partially offset by an extra week of
sales in 2006 due to the 53-week retail calendar for
2006. On a comparative 52-week basis, sales increased
approximately 8.8% in 2007 compared to 2006.
Comparable store net sales are positively affected by
our expanded and relocated stores, which we include
in the calculation, and, to a lesser extent, are negative-
ly affected when we open new stores or expand stores
near existing ones.