Dollar Tree 2008 Annual Report Download - page 18
Download and view the complete annual report
Please find page 18 of the 2008 Dollar Tree annual report below. You can navigate through the pages in the report by either clicking on the pages listed below, or by using the keyword search tool below to find specific information within the annual report.-
 1
1 -
2
-
3
-
4
-
5
-
6
-
7
-
 8
8 -
 9
9 -
 10
10 -
 11
11 -
 12
12 -
 13
13 -
 14
14 -
 15
15 -
 16
16 -
 17
17 -
 18
18 -
 19
19 -
 20
20 -
 21
21 -
 22
22 -
 23
23 -
 24
24 -
 25
25 -
 26
26 -
 27
27 -
 28
28 -
29
-
30
-
31
-
32
-
33
-
34
-
35
-
36
-
37
-
38
-
39
-
40
-
41
-
42
-
43
-
44
-
45
-
46
-
47
-
48
-
49
-
50
-
51
-
52
 |
 |

16
DOLLAR TREE, INC. • 2008 ANNUAL REPORT
Management’s Discussion & Analysis of Financial Condition and Results of Operations
turnover. Inventory per selling square foot also
decreased 1.2% at January 31, 2009 compared to
February 2, 2008.
On May 25, 2007, legislation was enacted that
increased the Federal Minimum Wage from $5.15 an
hour to $7.25 an hour by July 2009. As a result, our
wages will increase in 2009; however, we believe that
we can partially offset the increase in payroll costs
through increased store productivity and continued
efficiencies in product flow to our stores.
We must continue to control our merchandise
costs, inventory levels and our general and administra-
tive expenses. Increases in these line items could nega-
tively impact our operating results.
On March 25, 2006, we completed our acquisition
of 138 Deal$ stores, which included stores that offered
an expanded assortment of merchandise including
items that sell for more than $1. Most of these stores
continue to operate under the Deal$ banner while pro-
viding us an opportunity to leverage our Dollar Tree
infrastructure in the testing of new merchandise con-
cepts, including higher price points, without disrupting
the single-price point model in our Dollar Tree stores.
We have opened new Deal$ stores, including some in
new markets, and as of January 31, 2009, we have 143
stores under the Deal$ banner that are selling most
items for $1 or less but also sell items for more than
$1, compared to 131 stores at February 2, 2008.
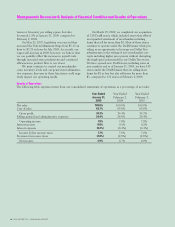
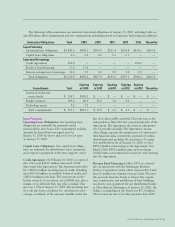
Results of Operations
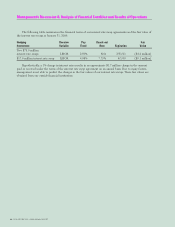
The following table expresses items from our consolidated statements of operations, as a percentage of net sales:
Year Ended Year Ended Year Ended
January 31, February 2, February 3,
2009 2008 2007
Net sales 100.0% 100.0% 100.0%
Cost of sales 65.7% 65.6% 65.8%
Gross profit 34.3% 34.4% 34.2%
Selling, general and administrative expenses 26.4% 26.6% 26.4%
Operating income 7.9 % 7.8% 7.8%
Interest income 0.0% 0.1% 0.2%
Interest expense (0.2%) (0.4%) (0.4%)
Income before income taxes 7.7 % 7.5% 7.6%
Provision for income taxes (2.8%) (2.8%) (2.8%)
Net income 4.9% 4.7% 4.8%